Restaurant analytics means connecting the operational data your restaurant already produces, from POS and inventory to labour, reservations, online ordering, and marketing, and turning it into decisions your team can act on. Two parts of that definition matter more than the words themselves.
It matters more in 2026 than it ever has. The National Restaurant Association’s 2026 State of the Restaurant Industry report shows food costs running about 34% above pre-pandemic levels, with 42% of U.S. operators reporting that their restaurants were not profitable in 2024. Whatever margin cushion existed in 2019 is gone, and operators who can’t see what’s happening across their data in real time are flying blind into the most difficult cost environment the industry has faced in decades.
This guide breaks down the metrics that actually move profit, the dashboards your team needs (and the ones they don’t), the data sources that power restaurant analytics, and how to build a stack designed to pay for itself through faster cost control, cleaner reporting, and better operational decisions.
Key Takeaways
- Prime cost is the single most important metric in restaurant operations — food and labor costs combined as a percentage of revenue. Keep it between 55–65%. Anything higher signals a structural problem.
- The four data sources that matter most are POS, inventory management, payroll/scheduling, and reservations. Get those four talking to each other and you’ve solved 80% of the visibility problem.
- Different roles need different dashboards. A GM checking morning numbers needs something different from a CFO building the quarterly review. Build for the role, not for “the restaurant.”
- Multi-unit groups have a different problem than single restaurants. Once you pass 5 locations, the question stops being “are we profitable?” and starts being “which locations are dragging the average, and why?”
- Real-time analytics only matter if they trigger action. A dashboard that nobody opens is wallpaper. The ones that get used connect every metric to a clear “if this, then that” rule.
What Restaurant Analytics Actually Means
Two parts of that definition matter more than the words themselves.
First, “one place.” If your sales data lives in Toast, your labor data lives in 7shifts, your food cost data lives in a spreadsheet, and your reservation data lives in OpenTable, you don’t have analytics. You have four silos and a guessing game. The unification is the analytics.
Second, “decisions your team can act on.” A dashboard that shows food cost is 34% is a chart. A dashboard that shows food cost is 34% up from 31% last month, driven by a 12% spike in protein costs that nobody caught and flags it the moment it crosses your threshold? That’s analytics.
Why Restaurant Analytics Matters More in 2026 Than Ever Before
The economics have shifted underneath the industry, and operators that are not tracking the right numbers are more likely to miss margin problems until they become difficult to fix.
Three forces converged in the last 24 months:
- Input costs are structurally higher. Food costs are running about 34% above pre-pandemic levels (NRA, 2026 State of the Industry). Whatever margin cushion you had in 2019 is gone.
- Labor costs are climbing in many markets, and full-service restaurants often feel the pressure first because their model depends on larger front-of-house and back-of-house teams. The operators who stay profitable are the ones holding labor costs disciplined — and they can only do that if they can see the number in time to act on it.
- Customers have more options than ever. Third-party delivery, ghost kitchens, retail prepared food, and improved grocery offerings all compete for the same wallet. Retention used to take care of itself. Now it has to be earned.
You can no longer afford to find out at the end of the month that food costs crept up 3 points. You need to see it the day it starts moving.
The 6 Restaurant Metrics That Actually Drive Profit
Most articles about restaurant metrics list 20 or 30 KPIs and call it a day. That’s noise. The reality is that six numbers explain most of what determines whether your restaurant makes money. Track these. Calibrate against industry benchmarks. Build everything else around them.
1. Prime Cost
If you only track one number, this is it. Prime cost combines your two biggest controllable expenses, food and labor, into a single figure expressed as a percentage of revenue. It tells you in one line whether the fundamental economics of your business are working.
Formula:
Prime Cost % = ((Total Food & Beverage Costs + Total Labor Costs) ÷ Total Revenue) × 100
Benchmark: Generally, many operators aim to keep prime cost between 55% and 65% of revenue, though the right target depends on the service model, market, rent structure, and menu mix. Above 65%, it is usually a sign that the business needs a deeper look at labour, menu pricing, purchasing, or sales mix.
What to do when it drifts: Investigate in this order: schedule first (are you staffed for actual covers, or yesterday’s covers?), then menu mix, then food cost. Most prime cost problems start with labor scheduling.
2. Food Cost Percentage
This is what your ingredients actually cost as a share of the revenue they generate. It’s the most-watched number in the kitchen and the one most likely to drift quietly without anyone noticing.
Formula:
Food Cost % = Food COGS ÷ Food Sales × 100
Benchmark: The average restaurant runs food cost between 28% and 35%, with full-service typically higher than QSR. Restaurants with strong beverage programs (alcohol, specialty coffee) often achieve lower blended food costs because beverage COGS is 15–25% versus 30–40% for food.
What to do when it drifts: Compare your theoretical food cost (what it should cost based on your recipes and sales mix) against your actual food cost. The gap reveals waste, theft, portion control issues, or pricing errors. A 2-point gap on $1M in food sales is $20,000 walking out the back door every year.
3. Labor Cost Percentage
Labor is the other half of prime cost and the one with the most operational leverage. You can’t change ingredient prices overnight, but you can change next week’s schedule.
Formula:
Labor Cost % = (Total Labor Cost ÷ Total Sales) × 100
Include everything: wages, payroll taxes, benefits, tips you pay out, and any contract labor.
Benchmark: Healthy labor cost varies by service model:
| Restaurant Format | Typical Labor Cost % | What It Reflects |
|---|---|---|
| Quick-service (QSR) | ~25% | Limited menu, smaller crews, faster ticket times |
| Full-service casual | 25–30% | More staff in both the kitchen and the front of house |
| Fine dining | 30–35% | Higher skill requirements, more intensive service |
What to do when it drifts: If labor is high but sales are high too, you’re probably scheduled correctly. If labor is high and sales are flat, you’re likely overscheduled. Use last week’s same-day-of-week covers to right-size next week’s schedule. The fastest way to get labor under control is sales-per-labor-hour, not headcount.
4. Table Turnover Rate
How many times can you fill the same seat with a paying customer during a service? In a fixed-capacity business, turnover is the lever that lets you grow revenue without growing your physical space.
Formula:
Table Turnover Rate = Total Parties Served During a Period ÷ Number of Tables
Benchmark: Varies wildly by format. A casual lunch spot might turn each table 3–4 times during a 90-minute window; a fine dining restaurant might turn the same table once over a 2.5-hour service. The right benchmark is your own; track it weekly by service and day of the week, and watch the trend.
What to do when it drifts: Low turnover during peak hours points to bottlenecks: slow kitchen tickets, inefficient checkout, and large parties lingering. Each is a different fix. Pay-at-the-table tech and tighter ticket coordination between FOH and BOH are the highest-leverage interventions.
5. Average Check (or Average Order Value)
Total revenue divided by total guests served. It tells you how much each person who walked in (or ordered online) actually spent.
Formula:
Average Check = Total Sales ÷ Total Guest Count
What to look for: Trends matter more than absolute numbers. If the average check is declining while traffic is flat, something is off. Servers may not be upselling, menu pricing may need adjustment, or your customer mix may be shifting toward lower-spend dayparts. Compare the trend by daypart (breakfast vs. dinner) and by channel (dine-in vs. delivery) to identify the cleanest signal.
Leverage point: A 5% lift in average check on $2M in revenue is $100,000 in new revenue with no new customers, no new locations, and no new marketing spend. Server training, menu engineering, and well-placed add-ons typically deliver this.
6. Customer Retention Rate
Repeat guests are usually where restaurant profitability compounds. New guests matter, but if they do not come back, the restaurant has to keep paying to replace them. In an industry where acquiring a new customer often costs significantly more than encouraging an existing guest to return, retention rate is the metric that quietly compounds profit, and the one most operators don’t measure.
Formula:
Retention Rate % = ((Customers at End of Period − New Customers in Period) ÷ Customers at Start) × 100
How to measure it in practice: If you have a loyalty program, reservation system, or online ordering platform, you have repeat-customer data. Tie it to your POS, and you can see exactly which guests are coming back, how often, and what they spend on each visit.
What to watch: Track retention by acquisition channel. Guests acquired through your direct online ordering channel often show stronger repeat behaviour than guests acquired through third-party delivery apps, because the relationship, data, and follow-up communication stay with the restaurant.
The Data Sources That Power Restaurant Analytics
You can’t analyze data you don’t have. Before you build dashboards, take stock of where your data actually lives because that’s your starting line.
Most restaurants have four core systems generating data, plus a handful of supplementary ones:
| System Type | Examples | What It Tells You |
|---|---|---|
| POS | Toast, Square for Restaurants, Lightspeed, Clover, TouchBistro | Sales by item, daypart, server, channel; ticket times; payment mix; discount usage |
| Reservations & guest management | OpenTable, SevenRooms, Resy, Yelp Guest Manager | Bookings, no-shows, party size, repeat guest behavior, demand by day/time |
| Inventory & food cost | MarketMan, MarginEdge, xtraCHEF (by Toast), Mycawan | Theoretical vs. actual food cost, waste, vendor pricing changes, par levels |
| Payroll & scheduling | 7shifts, Deputy, Planday, Homebase, ADP | Labor cost, hours worked, overtime, sales-per-labor-hour, productivity |
| Online ordering & delivery | DoorDash, Uber Eats, Grubhub, Olo, ChowNow | Channel revenue, basket size, delivery fees, third-party commissions |
| Marketing & loyalty | Klaviyo, Mailchimp, Punchh, Toast Loyalty | Campaign ROI, repeat visit rate, promo redemption, segment performance |
The job of an analytics platform is to make these systems behave as a single system. Sales data from Toast joins cleanly with labor data from 7shifts, which joins cleanly with inventory data from MarketMan in a single warehouse, with consistent date formats, store identifiers, and timezone handling. That’s the foundation everything else sits on.
The 5 Restaurant Analytics Dashboards You Actually Need
A common mistake is building one giant dashboard that tries to show everyone everything. It ends up useful to no one. The dashboards that get opened daily are the ones built for a specific role and a specific decision.
1. Daily Operations Dashboard (for GMs)
Opened first thing in the morning, glanced at it throughout the day. The point is real-time pacing against today’s targets, not deep analysis.
What goes on it:
- Sales vs. forecast, by daypart
- Labor cost % running in real-time
- Top 5 selling items today vs. typical day
- Reservation pacing for tonight’s service
- Voids, comps, and discounts hitting the day
2. Weekly Performance Dashboard (for owners and directors)
Reviewed every Monday morning. Shows what happened last week and how it compares to the week before.
What goes on it:
- Revenue by location, week-over-week and year-over-year
- Prime cost actuals vs. target
- Cover counts and average check trends
- Top movers (categories or items gaining/losing)
- Labor hours by role, with overtime flagged
3. Menu & Inventory Analytics Dashboard (for chefs and ops directors)
The kitchen’s P&L lens. Updated daily, reviewed weekly.
What goes on it:
- Menu engineering matrix — each item plotted by popularity vs. profitability (stars, dogs, workhorses, puzzles)
- Theoretical vs. actual food cost variance
- Waste tracking by category and shift
- Vendor price changes flagged
- Top profit-contributing items and the bottom 10 to consider removing
4. Customer & Marketing Dashboard (for marketing leads)
Connects what marketing is doing to what guests actually do.
What goes on it:
- Repeat visit rate by acquisition channel
- Loyalty program enrollment and active member counts
- Campaign ROI — spend vs. attributed sales
- Direct vs. third-party delivery channel mix and contribution margin
- Reservation source breakdown (OpenTable, walk-in, direct booking, phone)
5. Multi-Location Executive Dashboard (for chains and groups)
Once you have more than a few locations, the question shifts from “are we profitable?” to “which locations are pulling the average up, and which are dragging it down?”
What goes on it:
- Prime cost ranked by location, color-coded against target
- Revenue per labor hour by store
- Comp store sales (year-over-year for stores open 12+ months)
- Same-store traffic trends
- Outlier flags — locations more than 2 percentage points outside the group norm on any prime cost component

Multi-Location Analytics: A Different Problem
Single-restaurant analytics is about asking “what’s happening?” Multi-location analytics is about asking “which locations are different, and why?” — a fundamentally different question that requires fundamentally different reporting.
Three shifts happen as you scale:
- At 5–10 locations: You stop running each restaurant as a unit and start managing the portfolio. The questions become comparative: which location has the lowest labor cost percentage, which is leaking food cost, and which has the best comp sales trend? You need standardized metrics across stores, which means you need standardized POS coding, standardized recipe costing, and standardized labor categorization. Without that, you are comparing stores that look similar on the surface but are coded differently underneath.
- At 20–50 locations, market-level effects start to matter. A California location runs with a structurally different labor cost floor than a Texas location, and benchmarking them against the same target produces nonsense. You need market-adjusted benchmarks, regional rollups, and the ability to spot a location that’s underperforming its own market, not the corporate average.
- At 50+ locations: The management challenge becomes portfolio analytics. You’re managing a distribution, not a target. You need to identify which locations are at the bottom of the distribution, which are trending in the wrong direction, and which models or markets are systematically outperforming. The reports that matter become cohort views, trend lines, and outlier dashboards, not single-store rollups.
- The technology requirement is the same at every scale: a single warehouse that ingests data from every location, normalizes it to a common schema, and lets you slice by store, market, region, brand, or concept type without having to rebuild the report every time.
Success Stories: Boosting Business with Restaurant Analytics
Now that we understand restaurant analytics let’s examine real-life success stories. These case studies show the importance of using data effectively to optimize operations, improve customer satisfaction, and increase profits.
Case Studies Highlighting Tangible Benefits
A French restaurant owner tracks top menu items, peak hours, inventory costs and salaries in real-time
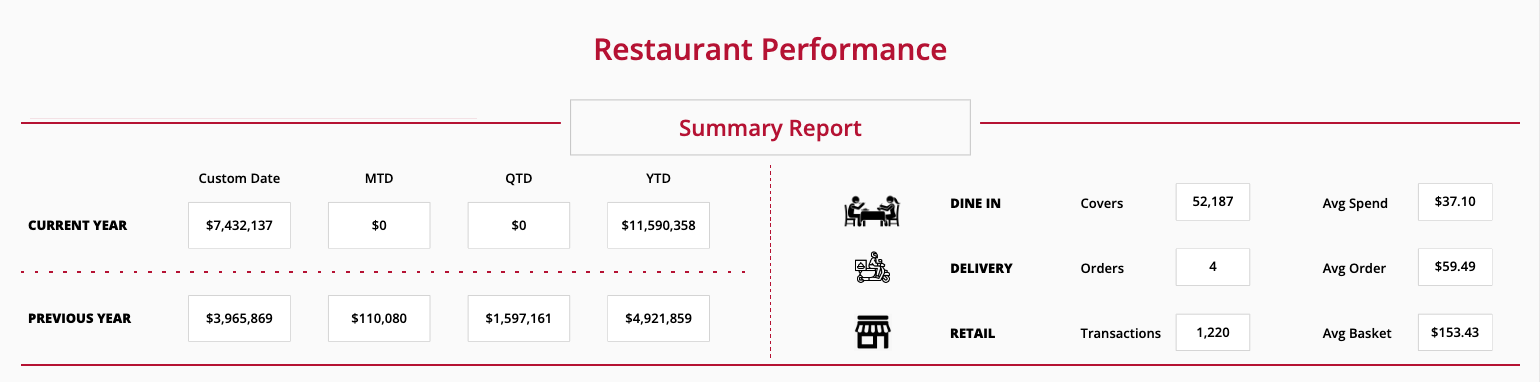
Our client was looking for a comprehensive analytics portal to measure the overall profitability of multiple restaurants and compare performance to previous year.
They wanted a clear picture of peak hours tracking per location while also measuring the impact of weather or holidays on covers, top menu items by volume and revenue, revenue per order type (dine-in, take-out, online order, delivery…) salaries and inventory cost.
They connected various data sources to build this dashboard:
- POS system: Lightspeed
- Inventory system: Mycawan
- Financial data: Airtable
- Schedule and payroll: Planday
- Bank and school holidays: French government API
- Weather: ClicData’s weather data template
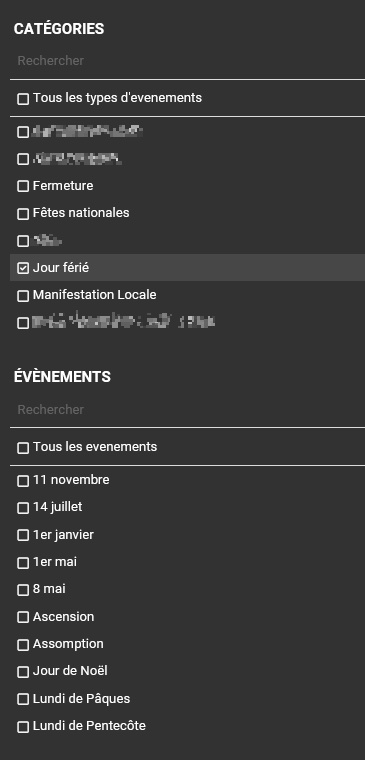
To measure the impact of public, school and bank holidays on each restaurant’s reservations and revenue, we can’t simply filter on a specific date as sometimes bank holidays are on different dates. Say you want to compare sales on Ascension Day this year vs. last year. Problem, the dates are different.
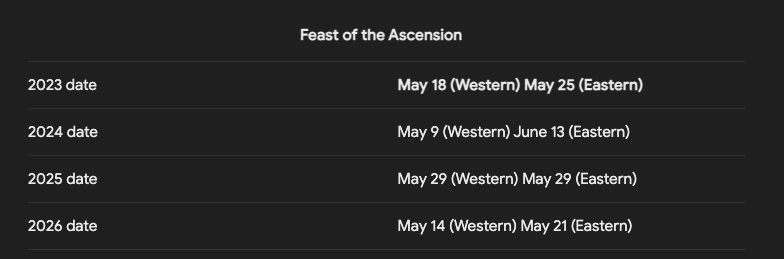
The solution was to connect ClicData to the French Government’s API to extract bank holidays and use filters per major bank holidays in addition to the standard date range selector.
With these filters, the client now has a simple and accurate way of comparing their stats year over year.
Mama Fu’s Asian House Bounces Back
Mama Fu is a well-known Asian restaurant chain that experienced a sales drop due to increased competition. To revive its profits, the restaurant used advanced restaurant analytics tools to identify peak customer hours and preferred menu items. Based on this data, it changed its menu and adjusted its offerings to provide better value at key times. These changes led to increased sales and a successful turnaround for the business.
How Olive Garden Used Data to Turn Around Their Fortune
Olive Garden, a well-known family-style Italian restaurant chain, struggled with decreasing profits due to inefficiencies in its daily operations. They used analytics tools to identify the causes of loss and areas of improvement. Analytics tools provided insights into inventory patterns, labor performance, and customer preferences.
Using this data, the restaurant adjusted its menu to use more cost-effective ingredients in popular dishes while reserving expensive ingredients for special items. They also matched staff schedules to busy times, ensuring enough staff during peak hours and avoiding unnecessary labor costs during quieter times. Additionally, they created targeted promotions based on what customers liked, attracting new and returning customers.
These strategies led to significant improvements in operational efficiency, ultimately increasing the total revenue.
Common Mistakes That Kill Restaurant Analytics Projects
Most analytics projects don’t fail because the technology is wrong. They fail because of a handful of preventable mistakes that show up over and over:
- Treating every metric as equally important. If your dashboard has 47 KPIs, nobody is actually reading any of them. Pick the six that matter for the role, and leave the rest in the data warehouse where they belong.
- Building dashboards nobody owns. Every dashboard needs a name attached to it — the person responsible for reading it, acting on it, and flagging when something’s broken. “The restaurant” doesn’t open dashboards. People do.
- Comparing this month’s MTD to last month’s full total. If you’re on the 15th and you compare 15 days of this month against 30 days of last month, this month always looks catastrophic. Always compare like-for-like — today’s MTD vs. last month at the same day count.
- Ignoring theoretical vs. actual variance. Knowing your food cost is 32% tells you the temperature. Knowing your theoretical food cost is 28%, a 4-point gap means $40K a year is leaking out the back door. The gap is where the money is.
- Treating delivery channel revenue as net revenue. A $20 order through a third-party delivery app might net you $13 after commissions, fees, and packaging. If your dashboard shows $20, it’s lying about your business. Always report contribution margin by channel, not just gross sales.
- Reviewing data without an action trigger. A dashboard without “if this, then that” rules is decoration. Every metric should have a defined threshold and a defined response when it crosses that threshold. Otherwise, you’re just watching numbers move.
How Do I Build My Restaurant Analytics With ClicData?
To get started with building your restaurant’s analytics using ClicData, follow these steps:
1. Sign Up for ClicData
- Sign up for a free trial account or book a demo with our product experts to get started smoothly.
2. Identify and Connect Your Data Sources
- Determine the key data sources you want to connect to ClicData. This could include your POS system, inventory management software, payroll system, marketing platforms, and customer feedback tools. Find the list of all our native connectors here.
3. Set Up Your Dashboards
- Start by creating dashboards to visualize the key metrics important for your restaurant. You might want to track sales trends, inventory levels, customer preferences, and employee performance.
- We offer customizable templates and drag-and-drop features to make dashboard creation easy.
4. Customize Reports and Alerts
- Set up custom reports that automatically update based on the latest data. You can also create alerts for specific metrics (e.g., when inventory levels fall below a certain threshold) to keep your operations running smoothly.
5. Collaborate and Share Insights
- Share your dashboards and reports with your team to ensure everyone is aligned with the business objectives. ClicData allows for easy sharing and collaboration, so all stakeholders can access the information they need.
6. Leverage ClicData Support
- Take advantage of our support and services teams. They can help you set up your analytics environment, map your data correctly, and provide guidance on getting the most out of the platform.
Frequently Asked Questions
Restaurant analytics is the practice of pulling data from your POS, inventory, payroll, reservations, and marketing systems into one place and using it to make operational decisions, from setting next week’s schedule to deciding which menu items to keep, change, or kill. The goal is to replace gut-feel decisions with decisions backed by what actually happened in your operation.
Six metrics carry most of the weight: prime cost, food cost percentage, labor cost percentage, table turnover rate, average check, and customer retention rate. If you track these six accurately and review them weekly, you’ll catch 90% of the problems that erode restaurant profitability.
The industry average ranges from 28% to 35% of revenue, depending on the format. Restaurants with strong beverage programs typically run lower because beverage COGS is 15–25% versus 30–40% for food. The more useful question isn’t “what’s the average” but “what’s the gap between my theoretical food cost and my actual food cost?” That gap is where the money is leaking.
Prime cost is the sum of food and beverage costs plus total labor costs, expressed as a percentage of revenue. It’s the single most important financial metric in restaurant operations because it captures your two largest controllable expenses in one number. Industry benchmark: keep it between 55% and 65%.
Start with the obvious cuts: total sales by day, daypart, location, channel, and item. Then layer in comparisons — this week vs. last week, this month vs. same month last year. The patterns that matter aren’t in the totals; they’re in the trends and the outliers. A dashboard that just shows totals tells you nothing actionable.
Most major POS systems, such as Toast, Square for Restaurants, Lightspeed, Clover, TouchBistro, and Aloha, expose data through APIs or direct connectors. Analytics platforms like ClicData connect to these natively, which means sales data flows automatically without manual exports. The integration question is usually less about “can we connect?” and more about “how well does the data normalize across locations using the same POS?”
What are the essential features to look for in a central analytics dashboard for multi-unit restaurant brands?
Five capabilities matter most: (1) native connectors to your POS, payroll, inventory, and reservation systems so you’re not exporting CSVs; (2) per-location and rollup views so you can see one store, one region, or the whole portfolio; (3) standardized metric definitions across stores so comparisons are meaningful; (4) alerts and thresholds so problems surface without someone having to open the dashboard; and (5) the ability to share dashboards across roles so the GM, the regional director, and the CFO each see what they need.
Most restaurants leave 2–5 percentage points of margin on the table simply because they can’t see what’s happening fast enough. Analytics helps in four ways: catching food cost drift the day it starts (not the end of the month), right-sizing labor schedules to actual demand patterns, identifying menu items that look popular but are unprofitable, and spotting which marketing channels generate guests who actually come back. On a $2M operation, recovering even 2 points of margin is $40K in profit.
For a single location, most operators are operational within one to two weeks — the first week connects data sources and configures core dashboards, the second tunes thresholds and trains the team. For multi-unit groups, the timeline depends mostly on how standardized your POS coding and recipe costing already are across locations. Standardize first, then connect.