Restaurant Analytics & Reporting Software for Multi-Location Operations
Why ClicData is a Powerful Restaurant Analytics Platform
Restaurants and Franchise teams We Work With

The Reporting Challenges Restaurant Operators Face
The result? Limited visibility, delayed decisions, and missed opportunities to improve performance.
Restaurant data typically lives across multiple tools: POS systems, delivery platforms, accounting software, payroll systems, inventory management tools and marketing platforms.
Bringing it together manually is slow, error-prone, and nearly impossible to maintain.
If you’re managing multiple locations or franchises, reporting often means chasing spreadsheets and exporting data from different systems.
By the time reports are ready, the data is already outdated.
Not all locations measure performance the same way.
Labour costs, food costs, and profitability are often calculated differently, making it difficult to compare locations or identify what’s actually working.
You can’t improve what you can’t clearly see.
Without centralized analytics, it’s difficult for restaurant owners and operators to get a clear view of location profitability, revenue trends, labour cost ratios, menu performance, operational efficiency
Without centralized analytics, these insights remain fragmented.
How ClicData Solves Restaurant Reporting Challenges


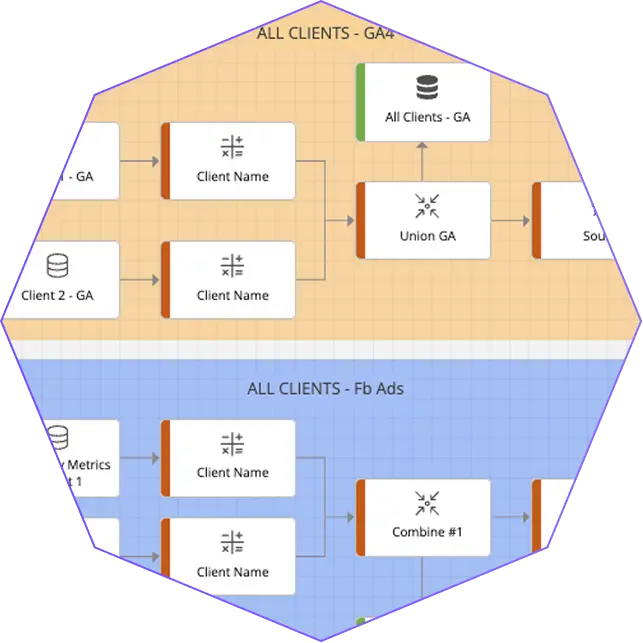
Automated Restaurant Reporting

Standardized Performance Metrics

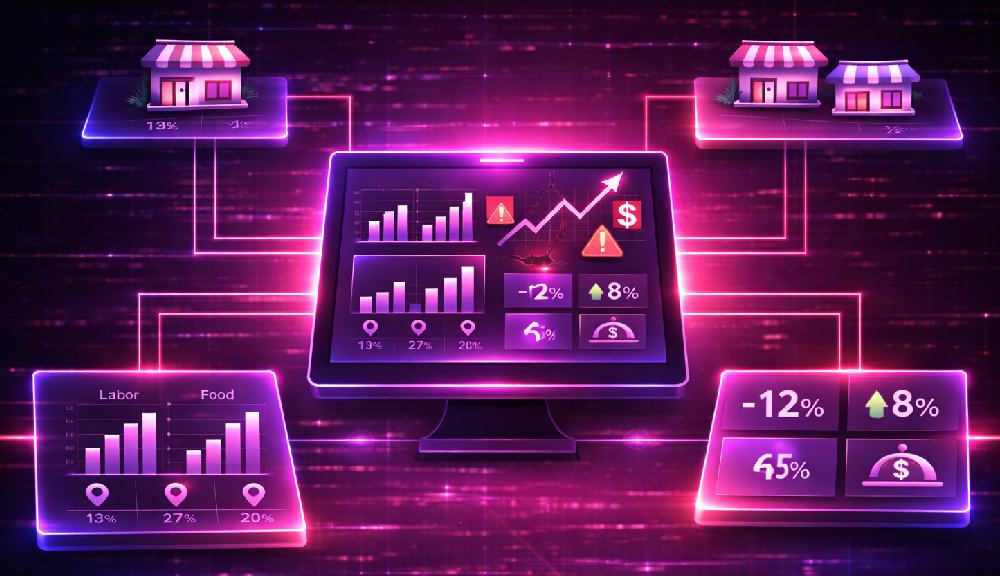
Multi-Location Performance Analysis

Scalable Reporting Infrastructure

Access Control For Every Level
Restaurant Dashboards & Reports Built Your Way


See how revenue, labour costs, and food costs roll up into a clear picture of unit-level profitability.
Stay on top of inventory levels, reduce waste, and tighten cost management across locations.
Bring operational data and accounting metrics together into one unified view of profitability.
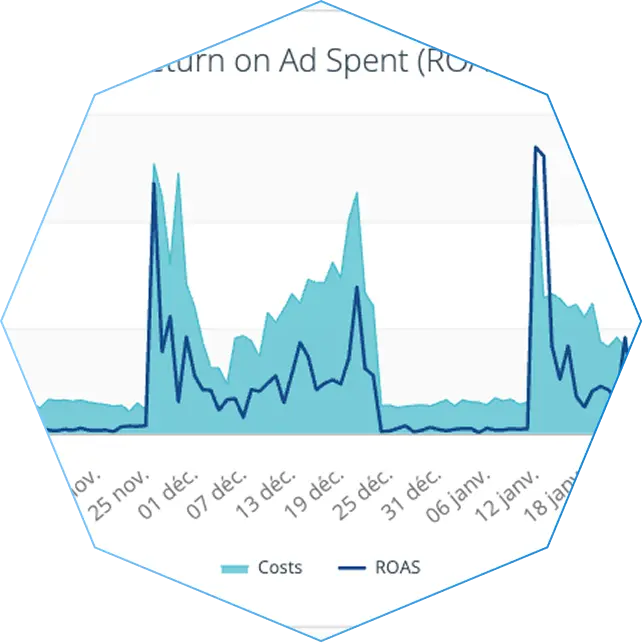
Break down delivery revenue alongside platform commission costs so you know what you're actually earning.
Discover More Restaurant Management Dashboard Examples
Your Restaurant Analytics workflow in 4 steps
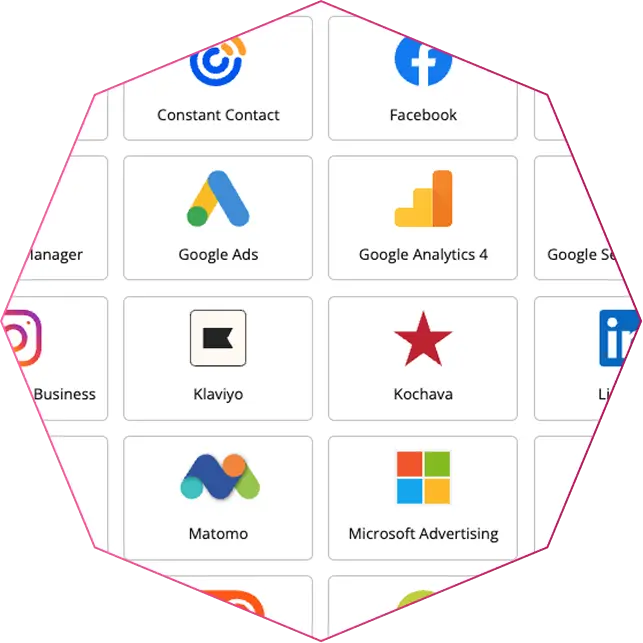
Pull data from your POS, accounting platform, delivery apps, and operational tools using 250+ Smart Connectors. No developer needed.
Start from a restaurant analytics template or build from scratch with 70+ visualization widgets: charts, tables, maps, KPIs, and more.
Define custom KPIs such as labour cost ratio, food cost percentage, and revenue per location.
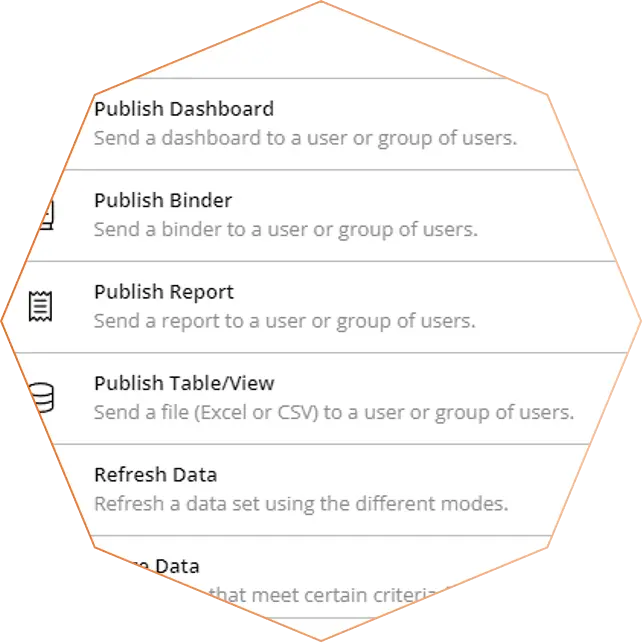
Set your dashboards to refresh automatically and get alerts the moment a metric crosses a threshold, before small problems become big ones.

Camille Borody

3 reasons to choose ClicData
for your restaurants

Extensive data connectivity

Personalized dashboards

Real-time alerts and notifications
We Are The BI Tool That Makes You Look Good

Restaurant analytics means connecting the operational data your restaurant already produces, from POS and inventory to labour, reservations,…
Read more →Labor costs quietly climbing by 2% at one location. Over-portioning that nobody catches until the food cost report…
Read more →Franchise alignment breaks down not because people don't understand the strategy, but because they can't see how it…
Read more →


Questions?
What KPIs should restaurant groups track across multiple locations?
The most valuable KPIs for multi-location restaurant groups fall into three buckets: sales (total revenue, sales per guest, average order value, order trends), cost control (labour cost percentage, food cost percentage, location-level profitability), and guest metrics (repeat visits, satisfaction indicators, customer frequency). The key is tracking these consistently across every location so you can spot underperforming stores fast. ClicData lets you define these KPIs once and auto-filter them by location, region, or franchise group — so every operator sees their own numbers against the same benchmarks.
Why is multi-location restaurant reporting so difficult without a centralized analytics platform?
Multi-location reporting becomes difficult when each location relies on separate POS instances, spreadsheets, accounting exports, delivery reports, or manually prepared summaries. Even when the raw data exists, it is often formatted differently across systems, refreshed at different times, and interpreted using different KPI definitions.
That creates slow reporting cycles and makes store-to-store comparison unreliable. Restaurant technology providers increasingly position centralized reporting as essential for chains and franchise groups because single-location reporting methods do not scale well.
How do restaurant chains analyze performance across locations?
Restaurant chains usually analyze performance by consolidating data from POS, labour, accounting, and guest-facing systems into a single reporting layer, then comparing KPIs across locations, regions, or brand segments.
This allows leadership teams to identify which stores are outperforming, which ones are losing margin, and where operational issues are emerging. Competitors in this space repeatedly highlight cross-location views for sales, labour, expenses, and guest metrics because that is one of the main decision-making needs for chain operators.
What data sources should a restaurant reporting platform connect to?
A strong restaurant reporting platform should integrate with the systems that actually drive daily operations and provide financial visibility. In most cases, that includes POS software, accounting systems, payroll or labour tools, delivery platforms, CRM or loyalty tools, and sometimes inventory systems or spreadsheets used for budget and target tracking.
Competitor messaging in this niche consistently emphasizes integrating data from multiple operational sources, as restaurant performance cannot be accurately evaluated from a single system.
How often should restaurant dashboards refresh?
That depends on the data source and the operating model, but restaurant dashboards are most useful when they update automatically on a recurring schedule and reduce the need for manual exports.
Operators often rely on dashboards for daily visibility into sales, labour, and order volume, while leadership may use weekly or monthly reporting views for broader performance analysis. In practice, the key requirement is reliability and automation: decision-makers should not have to rebuild reports by hand to understand what changed.
Is restaurant analytics software only useful for large chains?
No. Large chains and franchise groups benefit most from centralized reporting due to operational complexity, but smaller restaurant groups can also gain value from automated dashboards and standardized KPI tracking.
The need becomes more obvious when operators manage multiple sales channels, locations, or reporting systems. Even smaller groups often outgrow spreadsheet-based reporting once they need faster operational decisions and clearer visibility into profitability.