AI-Powered Insights in Dashboards & Reports
Turn data into information by using our Dashboards to create interactive data documents and our Reports module for pixel perfect PDFs.
More than one way to turn data into information

Dashboards
The dashboard that is so much more than a dashboard. It is a live data document that you can edit on any browser on your Mac, Windows or Linux machine.

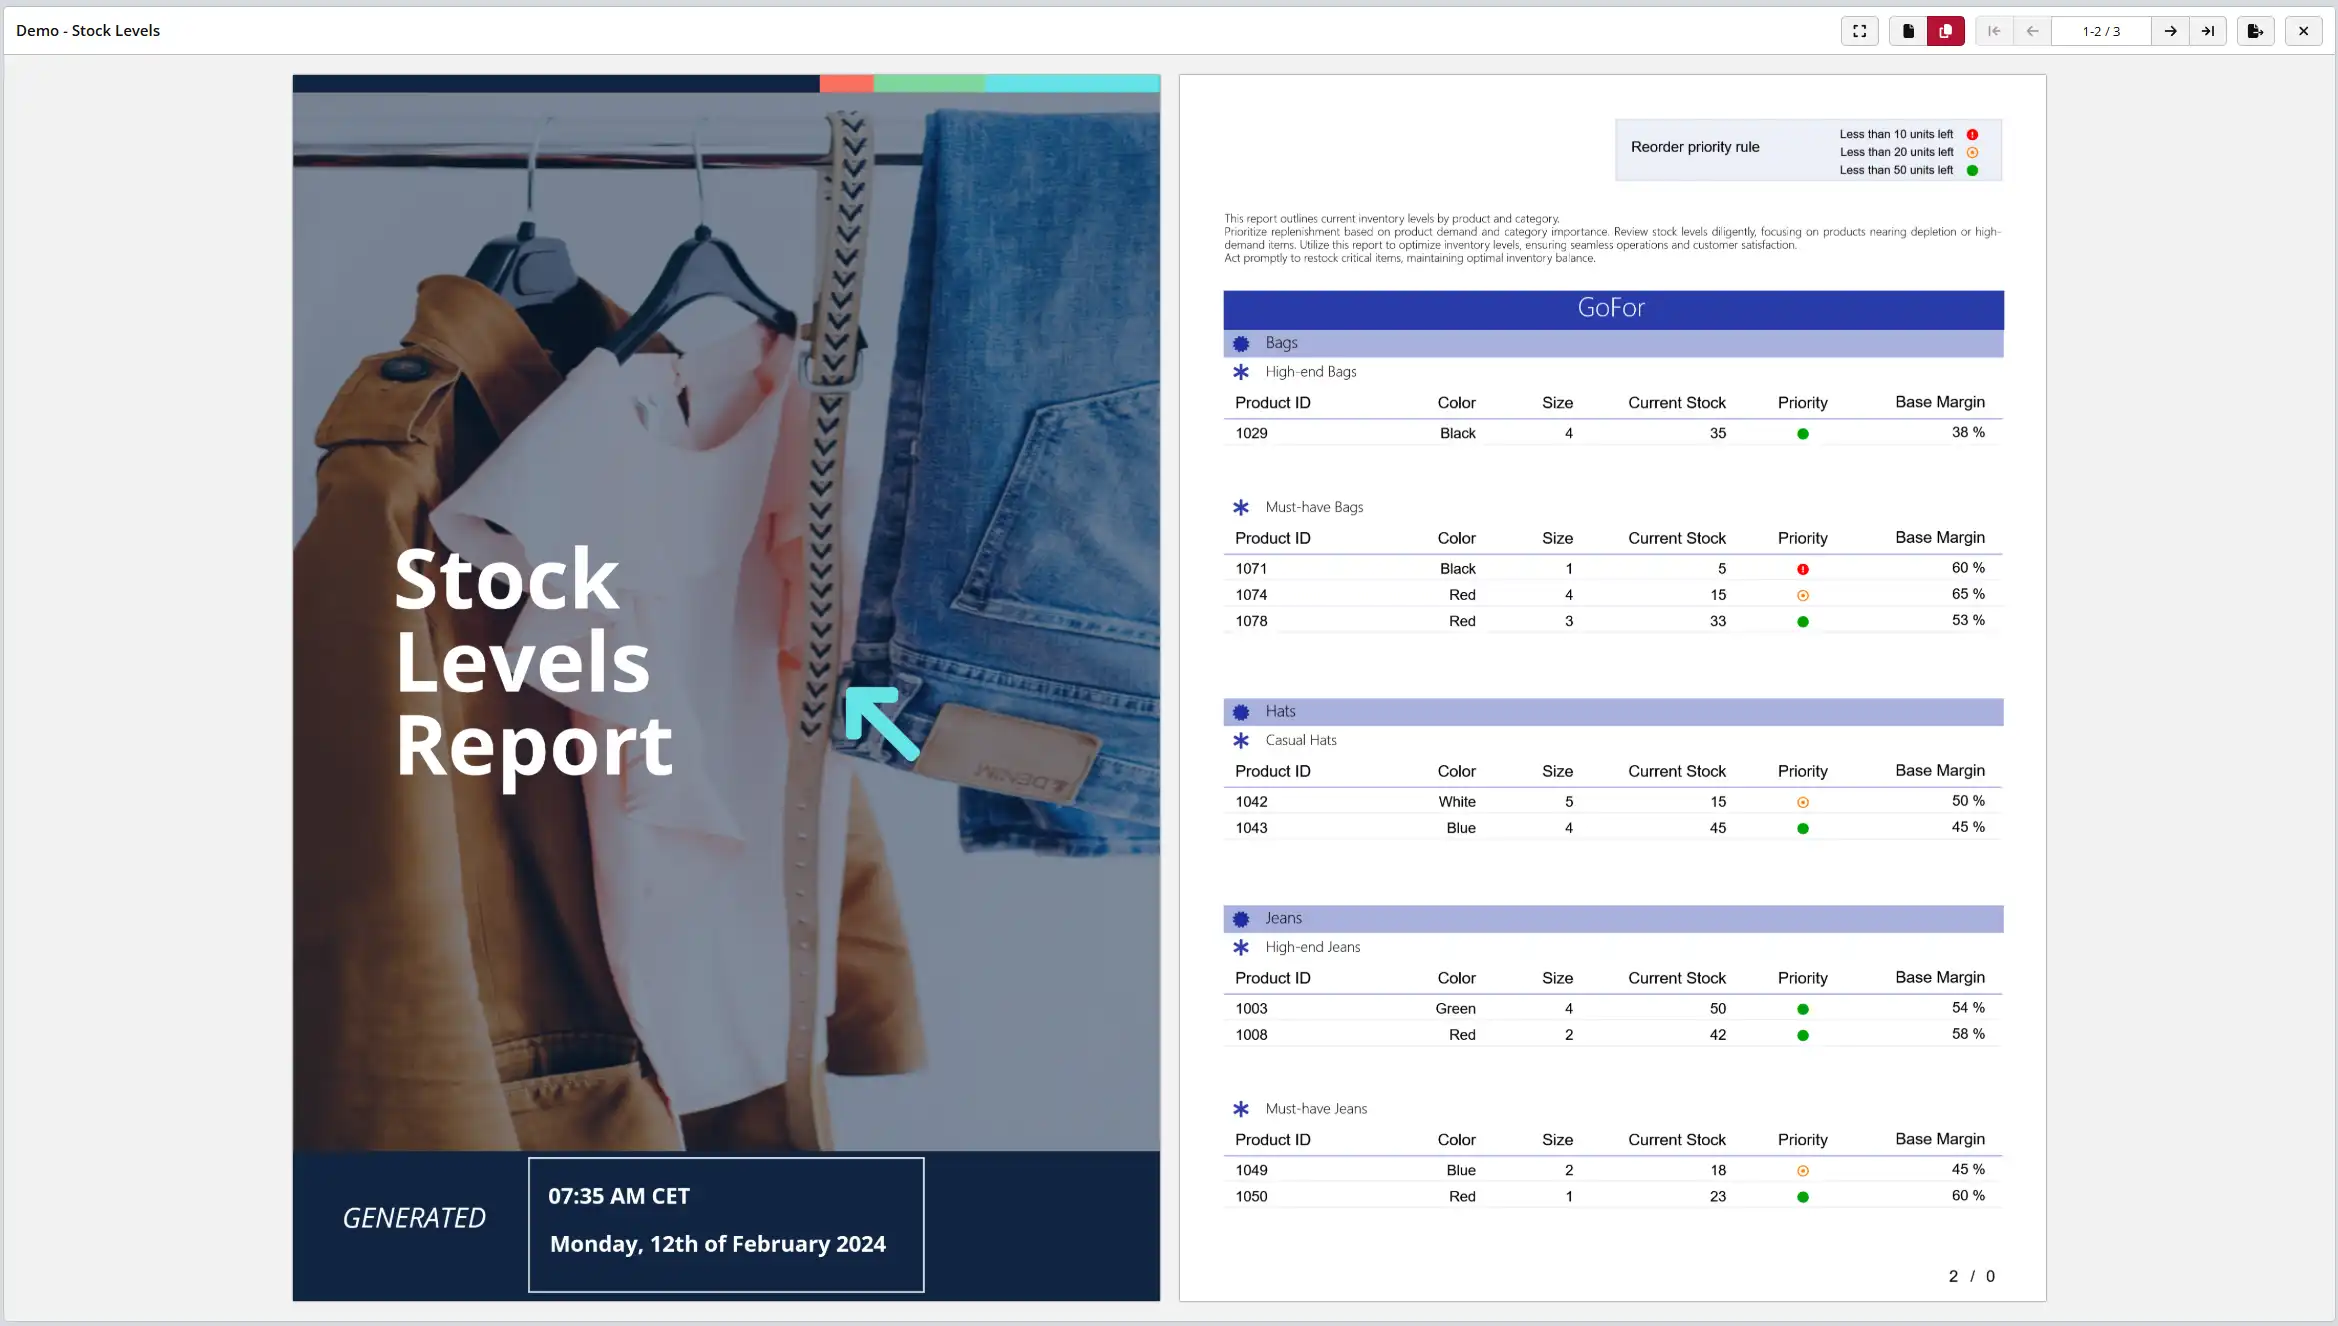
Reports
Sometimes a PDF is the best way to receive data. Use the report designer to build stunning reports with cover pages, conditional formats, charts and sub-tables.

Power BI & Excel
If you prefer to use Power BI or Excel as your visualization and reporting tool, then simply use our plugins and get instant data each time you open your XLSX or PBIX files.
Your Dashboard. Your Design. Your Style.
Our dashboard editor does not impose styles, placement or constraints on your design and corporate identity. Create dashboards for the mobile, tablet, TV, and browser with 10 out of the box themes and any color palette you can imagine. Optionally, start from one of our ready to use templates. We have over 110 templates ranging for almost any industry.


Build dashboards in your browser
No installation required. Just open up your favorite browser in your Mac or Windows machine and start dragging and dropping visualizations into your canvas. Start building in seconds...

AI Dashbord Builder - Coming soon...
- Automated Data InsightsUse agentic AI to autonomously analyze datasets, identify trends, and suggest actionable insights. The AI could detect anomalies, forecast future metrics, and recommend optimal actions without human intervention.
- Adaptive DashboardsUse agentic AI to dynamically customize dashboards based on user behavior and preferences. The AI could rearrange visualizations, highlight the most relevant metrics, and provide personalized insights for each user.
- Advanced Decision SupportDevelop AI agents that assist in decision-making by simulating different scenarios, predicting outcomes, and recommending the best course of action based on data-driven insights.
Ready to use Dashboard Templates
Take some inspiration from our collection of 100+ dashboard and report templates or use them right away simply by rebinding your own data.
See all dashboard examplesThe pixel perfect, multi-page, report builder

The report designer is a fully online designer capable of designing multi page reports that can be automatically or manually published in PDF. It can include data directly from the data sets, calculated columns, indicators, charts, sub-tables as well as markup features such as lines, rectangles and labels. Additionally it has the following features:
- Conditional formatting (color, font, visibility)
- Multiple data sets and sub-table linking
- Page break control
- Front and back cover designer
- Multiple section groups
- Runtime parameterization and filtering
- Designer alignment and snapping
- and more...
Power BI
Wait! Isn't Power BI a competitor?
Our mission at ClicData is to empower businesses and their data analysts to use their data the most efficient way possible. If you are comfortable with PowerBI (or any other tool for that matter), then use it.
Our job is to get you the data in a usable format and if Power Bi is the right tool for you to visualize the data then we built a great plugin for you to access the data inside your ClicData Data Warehouse directly from Power BI saving you the hassle of exporting it or moving it elsewhere.
Download the Power BI PluginOur mission at ClicData is to empower businesses and their data analysts to use their data the most efficient way possible. If you are comfortable with PowerBI (or any other tool for that matter), then use it.
Our job is to get you the data in a usable format and if Power Bi is the right tool for you to visualize the data then we built a great plugin for you to access the data inside your ClicData Data Warehouse directly from Power BI saving you the hassle of exporting it or moving it elsewhere.
We know you ❤️ Excel as much as we do
But we do get frustrated having to continuously create connections and paste data and make sure the formulas reference the new data, etc. etc. You know because you have been there before.
Well imagine building an amazing spreadsheet filled with awesome formulas, charts and dropdowns with data you exported from your systems. Then the next day you paste the data again and every formula breaks, errors appear everywhere or worse, wrong data is calculated.
Our plugin solves that by connecting your data tables in Excel directly to your ClicData Data Warehouse. Just open up the Excel spreadsheet, click Refresh and the entire data set in all your sheets will be refreshed.
 Download Excel Plugin
Questions?
Maybe the answer is here and if not then simply reach out to us.
Are there limits to how many dashboards or reports I can build and distribute?
No. Build as much as you can and share with as many people as you need to. You can share to internal and external people using public or password protected dashboards and reports or with named users using username and password even embed the dashboards and reports in web sites and applications.
What is the difference between a report and a dashboard?
A report is used when the amount of data, usually in a table format, can go across multiple pages or screens and varies in amount of rows. It can have charts as well as subtables but it is usually meant for distribution via PDF and are near pixel perfect. Financials, inventory, product catalogues, expense lists, are good examples of reports.
A dashboard has a more interactive component to it, a single screen that allows the viewer to immediately get an overview of all key performance metrics. It gives the viewer the capability of navigating within the dashboard, filtering, drilling down and slicing the data as well as navigating to other dashboards.
Do I have to pay for the Excel or Power BI connector?
No. Our add-on products are included for free and may be limited only by the plan you are on or the amount of data you have.
Is there any limitation to the number of data sources we can add to the dashboard?
No. You can mix all the data sources you want within the same dashboard. You can include data from your CRM, web analytics, or even your accounting systems.
Connect your data. Automate everything. Take actions.
Roll out your BI dashboards this week—We can help.
Get started for free