Plans & PricingSignup for FreeGet a demo

Trend Lines, Pivot Table, New Map Widget… ClicData 3.13!

Telmo Silvaon March 12, 2014

Dear Users,

This week we have updated ClicData to its latest release, v3.13!

So what does the latest iteration of your favorite dashboard application has to offer?

New Pivot Table & Trend Lines

ClicData has a brand new, fully customizable, pivot table to help you sort your data! It also includes a lot of cool features such as a heat map, display of totals and subtotals, full color customization and much more!

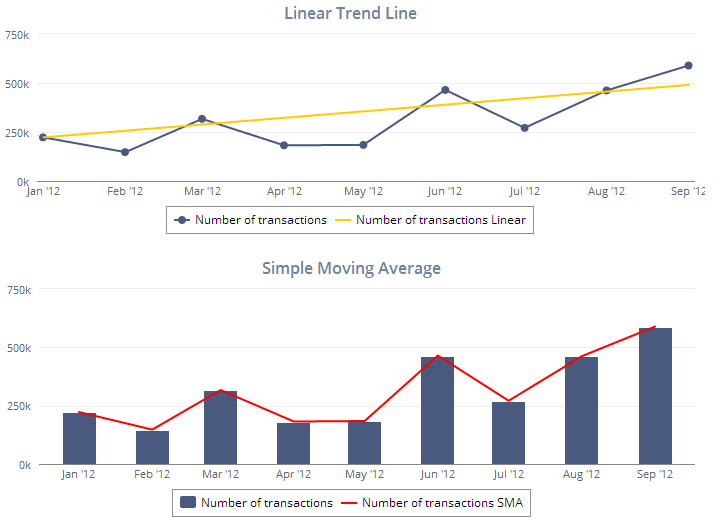
As an add-on to your current charts, you can now add trend-line such as moving average, linear trend, histogram and many others.

trendlines2

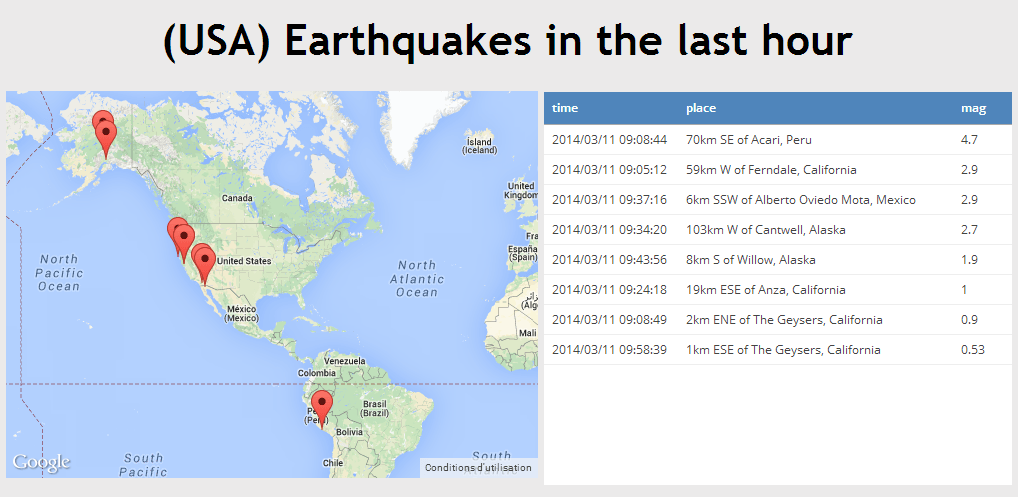
New Widget Maps – GPS Location

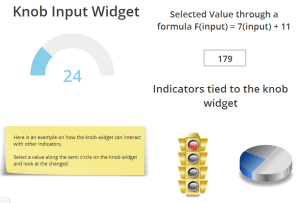
Let say you need to track multiple items on a map, in real-time or not, and you want it to be done with the ease of use of Google Maps…

Well, now you can do so in ClicData with our new map widget! A good example is worth a thousand words so just click on this dashboard below, fed with live data from the US government… and imagine you could do the same with… the position of your client deliveries for examples, pretty cool right?

USAEarthquakes

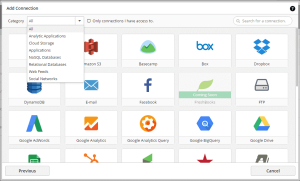
New Connector: Smartsheet 

Smartsheet users, you can now use our brand new connector to get your data directly from Smartsheet to your ClicData dashboards! You will be able to build analytics over your smartsheet projects.

And for those who don’t know, Smartsheet is an online project management and team collaboration SaaS application which is pretty similar to spreadsheets and that includes built-in cloud-capabilities for sharing, adding attachments, integration with file storage services and Gantt charts.

Log into your ClicData account right now to try out those exciting new features!

Happy Dashboarding!

Table of Contents

Share this Blog

Other Blogs

Shopify Analytics Dashboard for E-Commerce Brands

Shopify shows you what sold last week. What it doesn’t show you is whether that week was actually profitable — especially once you factor in your costs such as marketing, what…

From Data Cleaning to Data Intelligence: How AI Is Reshaping Data Prep

We spend a lot of time talking to mid-market data teams, and there's a version of the same conversation that comes up in almost every call. An analytics lead will…

GA4 Reporting Dashboard for Agencies

Managing Google Analytics reporting across dozens of clients is one of the most time consuming challenges facing modern marketing agencies. Without the right analytics reporting software, teams are stuck exporting…
All articles
We use cookies.
We use necessary cookies to make our site work. We'd also like to use optional cookies which help us improve our the site as well as for statistical analytic and advertising purposes. We won't set these optional cookies on your device if you do not consent to them. To learn more, please view our cookie notice.

If you decline, your information won't be tracked when you visit this website. A single cookie will be used in your browser to remember, your preference not to be tracked.
Essential Cookies
Required for website functionality such as our sales chat, forms, and navigation. 
Functional & Analytics Cookies
Helps us understand where our visitors are coming from by collecting anonymous usage data.
Advertising & Tracking Cookies
Used to deliver relevant ads and measure advertising performance across platforms like Google, Facebook, and LinkedIn.
Reject AllAccept