Hey there ClicData Users!
With the recent update we have added a Knob widget, so I’ve decided to show you what kind of interesting features it can add to a dashboard.
The knob feature is primarily a numerical input, it will allow you to do many things through a very graphical way.
*Click on any screenshots you see on this post to directly access the dashboard and test its functionalities.*
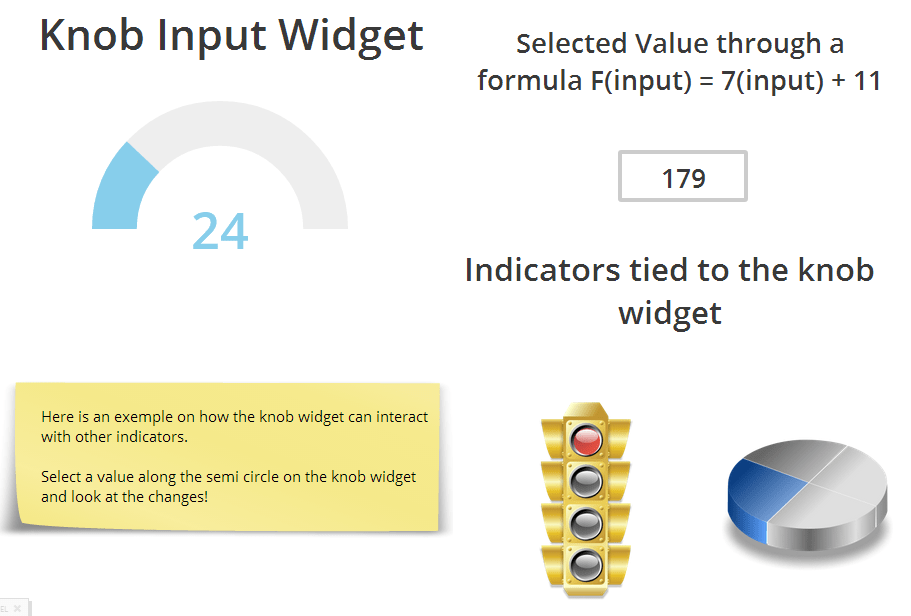
As a numerical input, the knob can be used as a way to select a specific number. In this dashboard, the top left knob widget is used as an input for a formula through a calculator widget, or to display advancement or a state on 2 indicators.
Remember that in ClicData, Inputs and indicators can work between 2 different dashboards. So you can have a knob setting a value on a dashboard and have that value used for indicators on another dashboard!
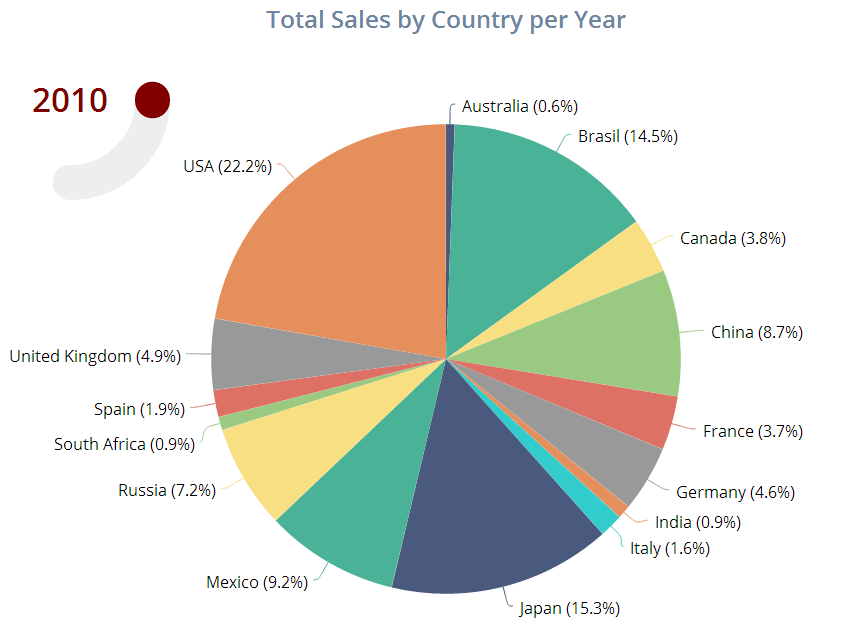
You can also use the knob as a filter / selector for your other indicators. In this dashboard you can select the year through a knob for a pie chart representing the % of sales per country.
It’s much cooler than using a normal list! ;)
Hoped those few tips helped you, remember you can click on any of those screenshots to try the examples displayed on this post, our dashboards are interactive!
Happy Dashboarding!