This is the translation of a post from chili-conversion.de, a German blog about optimizing digital Analytics and online Marketing.
Its Author, Danny Behne, is a digital consultant responsible for the development of SEO & Online marketing strategies for clients of mediaworx berlin AG.
Data aggregation is a must for anyone who wishes to take full advantage of all available data. ClicData bundles several technologies under one powerful tool to visualize your data. Because of the plethora of the dashboard SaaS solutions currently available, we looked closely at what that tool has to offer. ClicData gave us access to a full premium version of their platform.
Overview:
- USPs of ClicData
- Setting up a dashboard
- Use of formulas
- ClicData benefits
- ClicData disadvantages
The focus of our test was to visualize analytics data from our website using ClicData
In this example, we have used Google Analytics data.
The USP of ClicData
Most Dashboard tools work by setting a direct connection to a data source you want to work with.
ClicData imports data in many other ways. The connection is either carried out one time or you can set up a automatic refresh which we’ll talk about again later. ClicData is the only tool we’ve seen which allows you to select the location of your data center, either in the US or in the EU (Netherlands). This is especially handy from a customer perspective if you need or want to host your data overseas.
Setting up a dashboard
Creating a dashboard with ClicData is very simple.
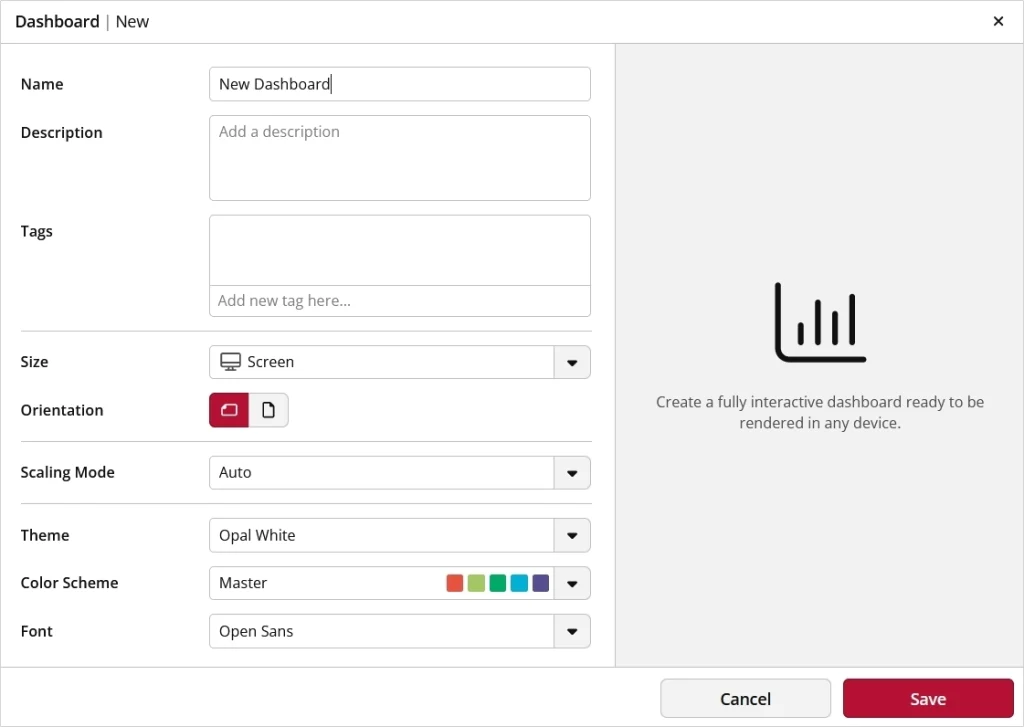
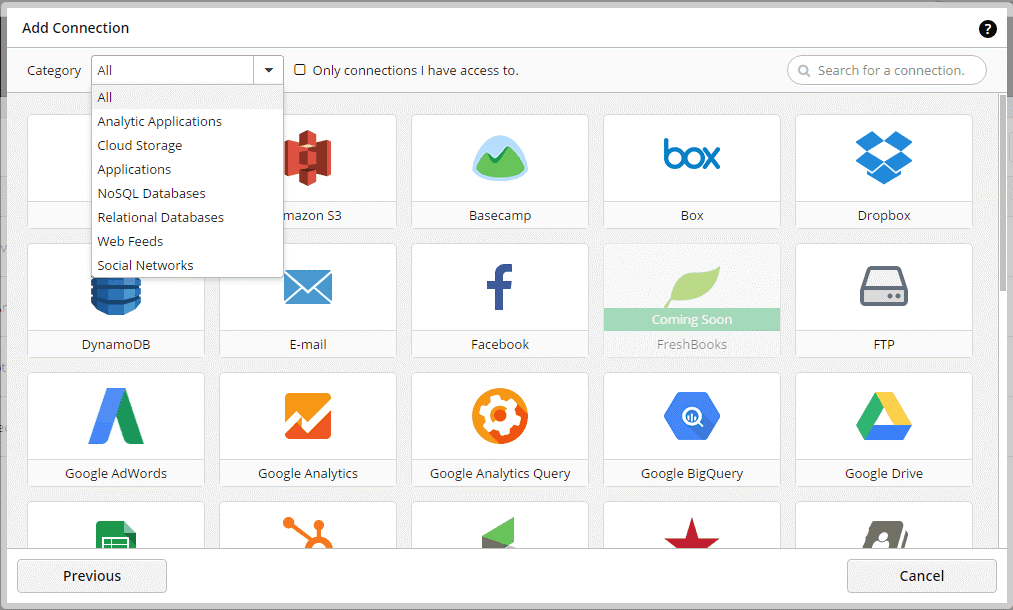
Selecting the Data Source
The range of data connectors available is relatively large. It does not only cover simple data files but other cloud applications and various databases systems. You can also create your own data tables within the application, although those may be complicated to update.
Select metrics and dimensions
In our example, we only used data from Google Analytics.
You can preview your data right before importing them. In this case, some advanced settings are available such as importing segments or select a start date, but this method has two limitations. The first one, you can only import 7 dimensions and 10 metrics, the second one is that all of Google Analytics dimensions and metrics are not available. However, ClicData also includes the possibility to directly input a query using the Google API (Google Analytics Query). You can use the Query Explorer to create those queries.
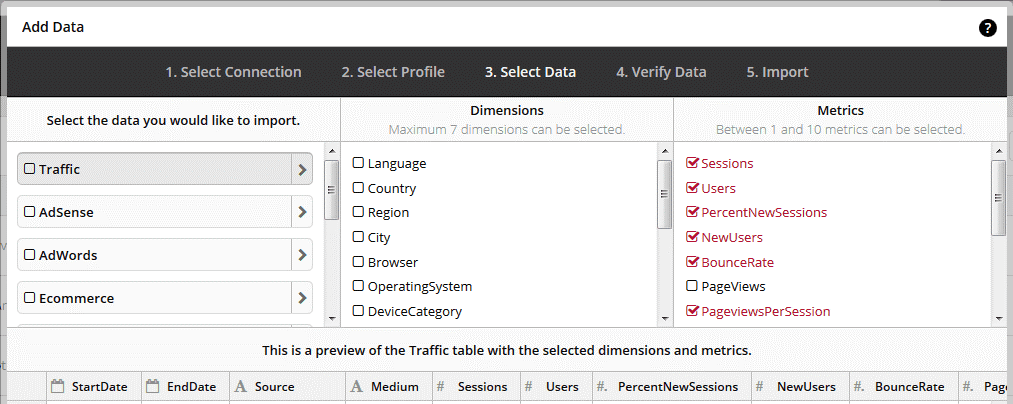
limited selection Google Analytics metrics
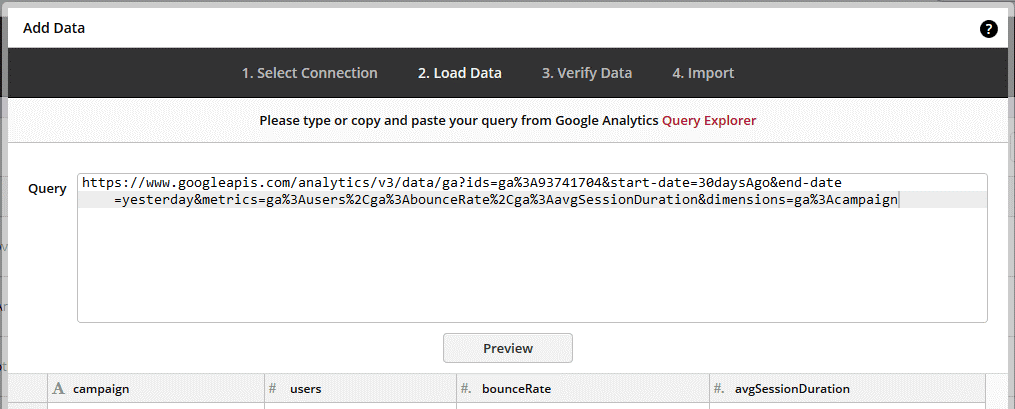
Google Analytics metrics selection via API Query
Insert Dashboard widgets
You have access to a large choice of visualization widgets. Besides the famous data charts, you can use items such as pictures, calendars or interactive buttons. They are child’s play to set up to visualize your metrics.
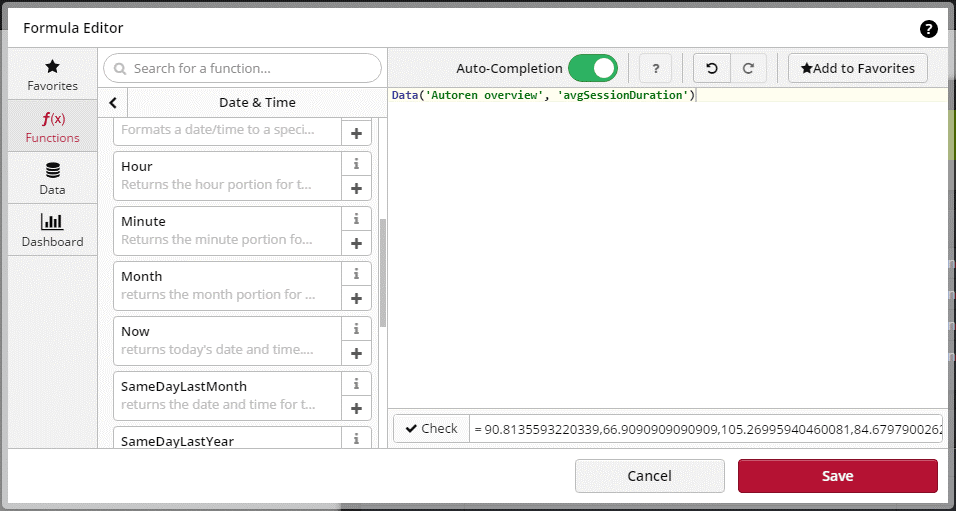
Using Formulas – A very powerful feature
It is always complex and somewhat tricky when you need or want to merge different sets of data or try to compare them. ClicData offers the possibility to input formulas which allow users to enhance their data. This a very powerful feature to manipulate and work on the data after it has been imported.
If you can master this feature of ClicData, your job will become a lot easier.
Our tip: To start on the right path and save a lot of time, you should get the support of somebody who is already savvy with those functionalities with professionals.
Benefits of ClicData
Automatic data update – You can select the exact time & date at which you want your data and dashboards to be updated. The advantage of such a non-permanent connection is the security it offers and the possibility to schedule exactly when you want your data to be refreshed.
Connector selection – Being able to connect to a lot of different technologies, to aggregate and work on your data has become almost a mandatory part of every serious dashboard tool. Because it includes such features, ClicData is a serious contender. In our test, the integration of the Google Analytics API has completely convinced us.
Widget selection – To visualize your data, ClicData provides an extensive set of widgets. In addition, you can drag & drop your data sources directly onto your dashboards and ClicData will display a preselection of appropriate widgets.
Disadvantages of ClicData
Example dashboards unavailable – To familiarize yourself with ClicData, the application offers sample dashboards you can import to your account. This is especially useful as it helps users understand how certain complex widgets work. Since ClicData is not fully ready for the German Market, those sample dashboards are not yet available to German users.
Integrated chat function does not exist – As already mentioned, it could be useful to talk to the support when working with formulas. Contextual help is often present when using the tool but it’s not enough to answer individual questions. It’s too bad a chat feature wasn’t integrated. To contact the support, you will have to use the support ticket function with your questions.
Conclusion
Thanks to the variety of data connectors available, ClicData is a fit for any company looking for a solid solution to make the best out of their data.
The depth of customization you can achieve with visualization widgets actually requires a profound knowledge of the formulas system and induces a lot of complexity. With ClicData, you can visualize complex data relationships, however, it will often require the help of a data expert.
Regarding Pricing, ClicData belongs to the classic market average, however, they do offer smaller packages depending on your requirements.