With the ever-evolving data management landscape, data analysts are tasked with delivering actionable insights, streamlining workflows, and staying ahead of technological advancements. Our 2025 roadmap focuses on these challenges by enhancing our platform with tools that redefine data management, data visualization, predictive modeling, and AI-powered analytics.
As explained in a previous blog, we keep innovating our platform to become the best modern data stack for data teams in mid-size and larger organizations —a cloud-based ecosystem that efficiently handles the entire data lifecycle. Scalable and capable of processing structured and unstructured data, it empowers businesses to collect, analyze, and automate workflows seamlessly. We integrate all these components into one powerful platform, setting the stage for deeper business insights.
This article introduces the innovations planned for 2025 that will empower data analysts to optimize and automate your workflows to achieve deeper business understanding.
Revolutionizing Data Management with New Tools and Features
Data management is the foundation of effective analytics, and we are introducing a series of enhancements to streamline data ingestion, transformation, and storage.
Expanding the Connector Ecosystem
We will be adding several new connectors to our platform to simplify data integration for analysts across industries:
- Veeva Vault Connector: Designed for pharmaceutical and life sciences professionals, this integration ensures seamless access to industry-specific datasets.
- TikTok Shop and Amazon Vendor Central Connectors: These additions extend access to retail and e-commerce data, enabling deeper insights into consumer trends and supply chain dynamics.
Advancing Data Flows
Our enhancements to data flows introduce greater flexibility and control over data processes:
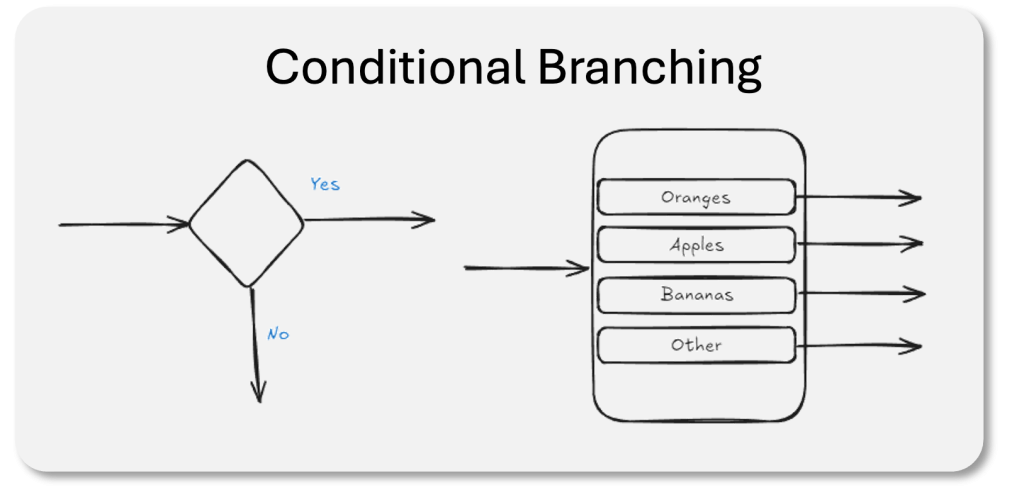
- Conditional Branching: This feature allows analysts to create multiple workflow paths, supporting scenarios such as testing in development environments before deploying in production.
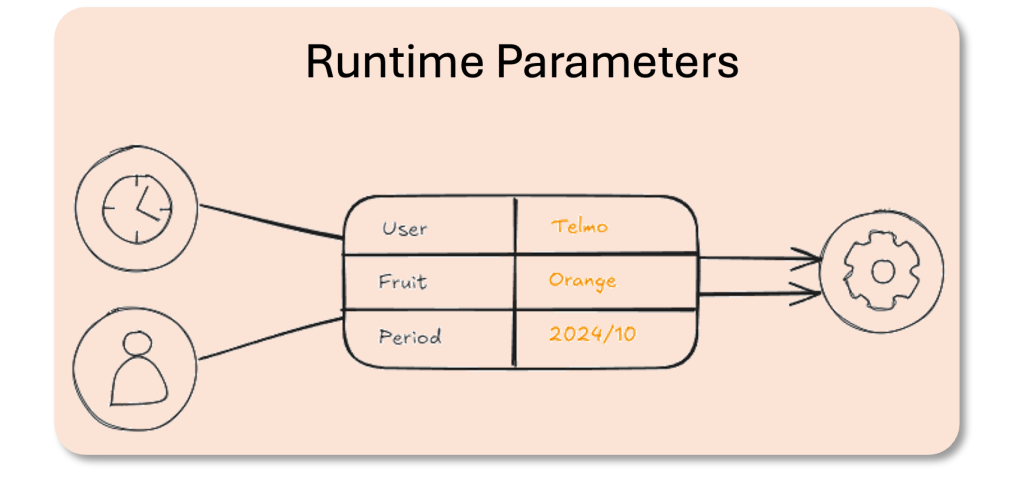
- Runtime Parameters: These enable workflows to adapt dynamically based on scheduling inputs or external triggers, offering greater responsiveness and automation.
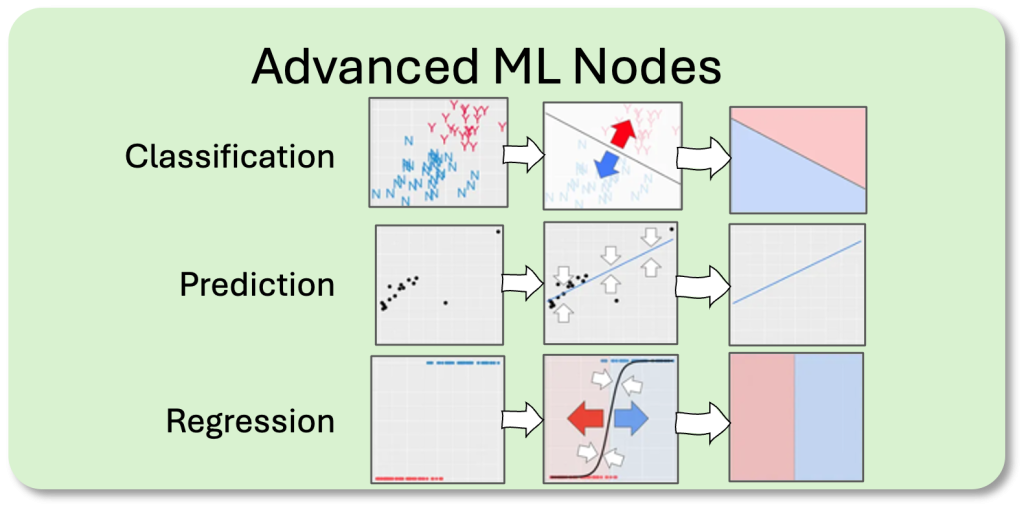
- Machine Learning Nodes: We integrate advanced ML functionalities, including classification, regression, and predictive modeling. You can also compare models to identify the most effective approach for specific datasets.
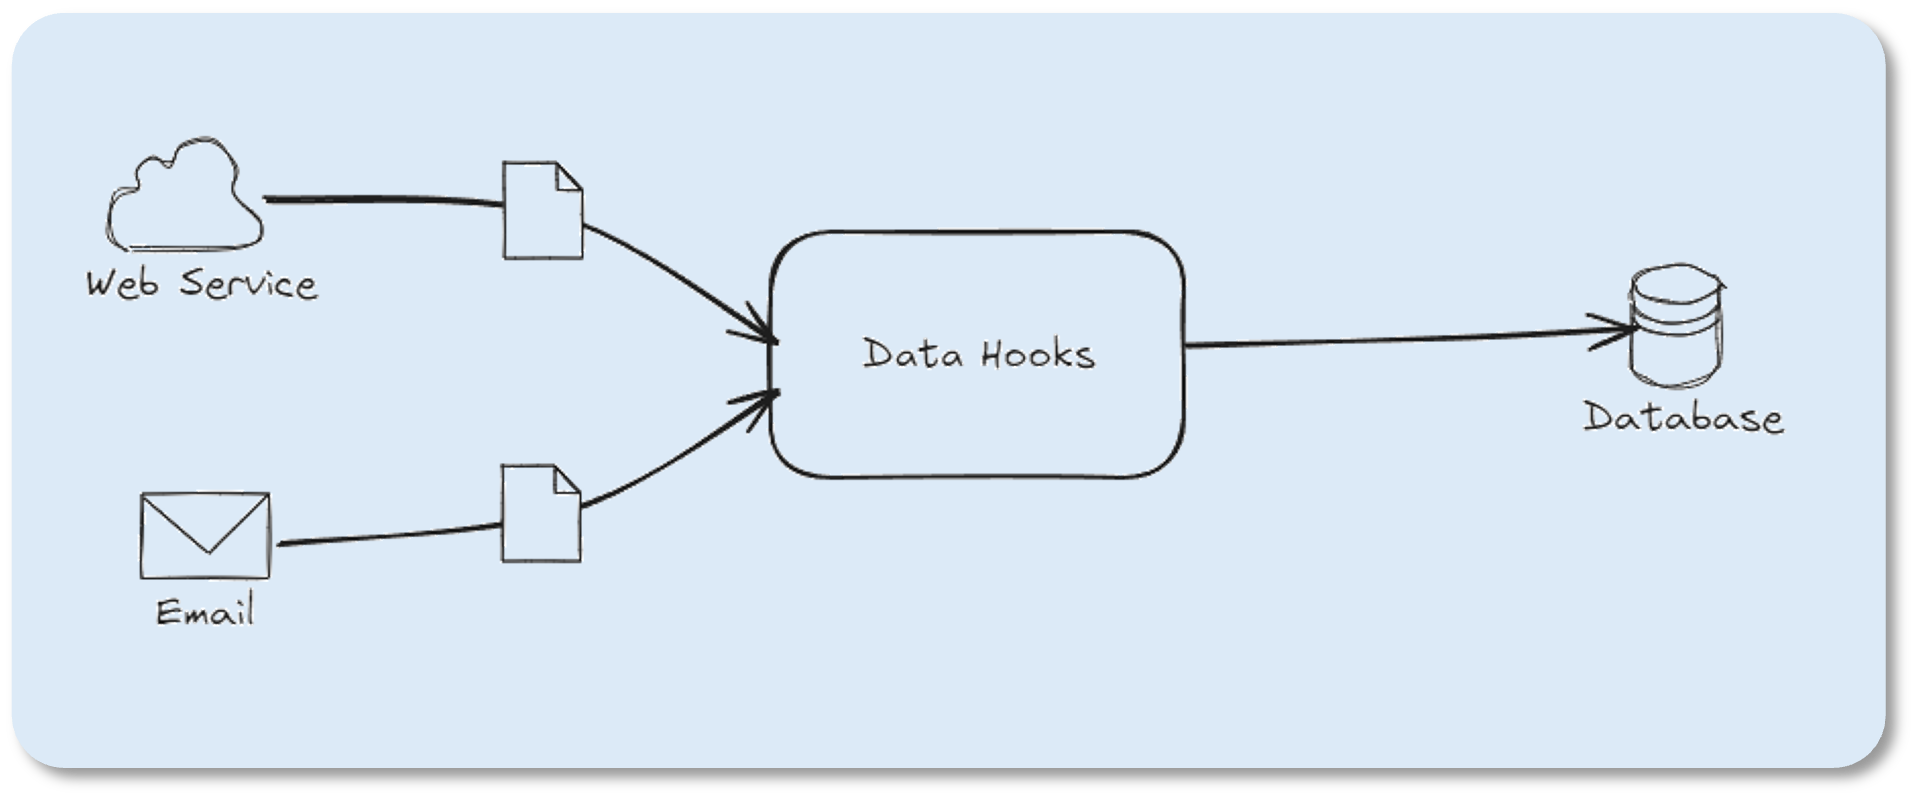
Data Hooks for Intelligent Data Capture
The Data Hooks module has emerged as a vital feature for integrating and automating data ingestion and processes.
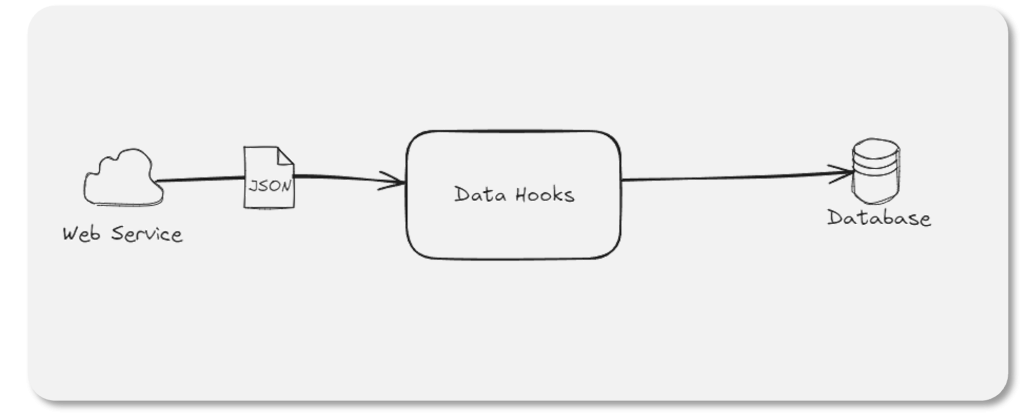
Initially designed for handling structured JSON data, it is now being expanded to process unstructured inputs such as emails. Upcoming enhancements include:
- Custom Email Addresses: Configure branded email addresses (e.g., invoices@company.com) to automate data collection tasks.
- Expanded Actions: Data Hooks will soon support a broader range of triggers, enabling you to execute workflows beyond data ingestion, such as sending alerts or performing downstream transformations.
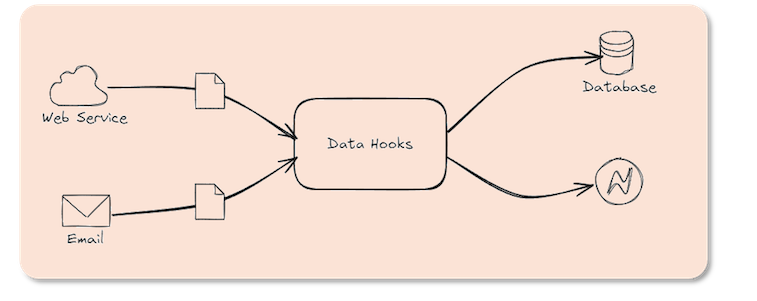
By bridging the gap between unstructured and structured data workflows, Data Hooks further enhances automation capabilities, ensuring a smoother transition between data entry points and analytical processes.
Scaling Machine Learning module
We are commited to enhancing our Python-friendly Data Scripts module, with plans to support additional languages like R.
The platform’s advanced infrastructure improvements are desgined to scale processing capabilities for large datasets, enabling analysts to perform predictive modeling and AI-driven analysis more effectively.
Upcoming Features:
- Execute Scripts from Data Flows: Integrate scripting seamlessly into workflows.
- Graphical Output: Support for libraries like Matplotlib will allow analysts to visualize data directly within scripts.
- Improved IntelliSense: Enhanced editor capabilities to simplify development.
- Faster Start-Up Times: By optimizing the script execution, you will see reduction in cost and performance improvements.
Dynamic Views for Streamlined Operations
The transition from traditional views to Dynamic Views represents a significant improvement in how data is handled in ClicData. These virtualized views are:
- Fast and Efficient: By eliminating caching and persistent storage dependencies, operations like filtering, grouping, and calculations become instantaneous.
- Personalized: Dynamic Views adapt to user-specific needs, ensuring secure access while maintaining scalability and performance.
- Integrated: Analysts can incorporate Dynamic Views into downstream processes such as dashboards, alerts, and data streams, simplifying reuse and ensuring consistency.
This modernization of data management tools underscores ClicData’s commitment to equipping analysts with the flexibility, speed, and power required for today’s dynamic analytics workflows.
Enhancing Data Storage and Automation
As data volumes grow, so does the need for efficient storage and reliable automation. Our 2025 roadmap introduces several features to meet these demands while optimizing performance and cost.
Optimized Delta Loading and Storage Options
Transactional logging for updates and appends will significantly reduce processing times, offering a performance improvement of up to 10x – 50x. In addition, we are expanding storage options to include PostgreSQL and Amazon RDS, providing cost-effective and scalable solutions tailored to business needs.
In-house Data Lake
The revamped Documents & Media module, now renamed File Storage, offers enhanced capabilities, making it a versatile data lake and a key component of the platform. Designed to function as your primary data lake, this updated module enables seamless integration between file storage and other data management components within the platform.
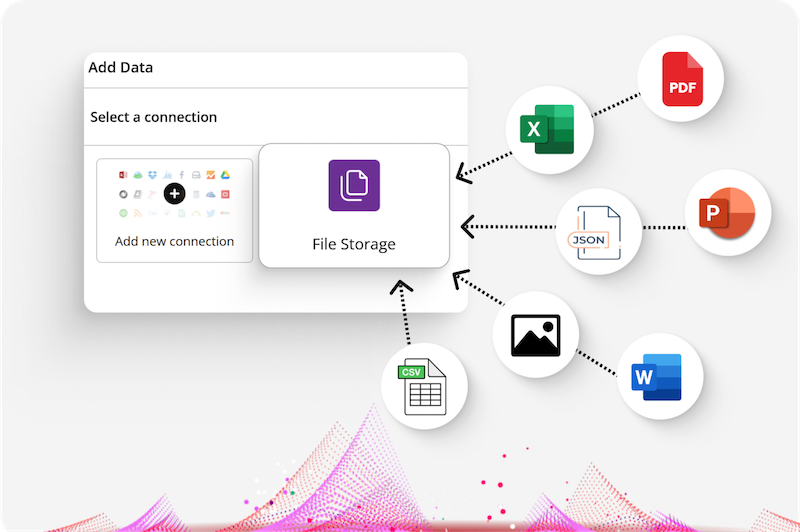
Supported Formats
File Storage supports diverse formats, including:
- Structured Data: CSV, Excel, Parquet, JSON.
- Unstructured Data: PDFs, scanned images, and binary files, which can be processed using OCR and other advanced parsing tools.
- Multimedia: Images and videos for varied use cases.
These capabilities allow to centralize and process multiple data types efficiently.
Integration with Tables and Views
File Storage integrates seamlessly with Tables and Views, bridging raw data and structured analysis. Analysts can:
- Load structured data directly into Tables for aggregation and filtering.
- Parse unstructured data into formats usable in Dynamic Views or dashboards.
- Automate synchronization to reflect file updates across workflows, ensuring consistency with minimal effort.
You can now automate data updates, minimizing manual intervention and ensuring consistency across workflows.
Introducing Modular Task Flows
Task Flows separate automation logic from schedules, introducing greater flexibility in managing workflows. This modular approach allows analysts to define conditional tasks that respond dynamically to data events or triggers, enabling more nuanced and efficient automation strategies.
Transforming Data Visualization and Collaboration
Visualizing data effectively and fostering collaboration are critical for driving insights and making data actionable. Our vision is to introduce a range of features to elevate the user experience in data visualization and teamwork.
Next-Generation Dashboards and Widgets
We plan on launching a revamped dashboard system (v2) with three layout options: absolute, grid, and infinite.
- Absolute Layout: Maintains current widget positioning, offering precise control over placement.
- Grid Layout: Dynamically aligns widgets to improve design consistency.
- Infinite Layout: Provides a freeform space for exploratory and relational data analysis.
To streamline dashboard creation, we are also introducing reusable widget catalogs, enabling users to tie widgets directly to datasets. Updates to the underlying dataset automatically reflect across all dashboards utilizing those widgets, promoting consistency and efficiency.
Widgets can now also be saved as templates for customized modifications, allowing users to balance flexibility with adherence to design standards. Furthermore, direct-to-source data binding allows widgets to pull data directly from source connections, enabling real-time visualization without relying on interim data warehousing.
Enhanced Reporting and Insights
On the reporting front, faster PDF rendering and mobile integration ensure timely access to critical data.
The Insights module is receiving significant upgrades, including:
- Side-by-Side Dataset Comparisons: Compare scenarios directly within the module for deeper analysis.
- New Visualization Options: Expand your toolbox for presenting findings.
- Seamless Conversion: Quickly turn insights into reusable dashboard widgets for immediate application.
These features make it easier for data teams to do data exploration, and present their findings in compelling formats.
Introducing LiveDocs for Dynamic Reporting
Finally, the very long awaited LiveDocs module will be launched in 2025. LiveDocs represents a transformative approach to report automation. Analysts can upload pre-designed templates in PowerPoint or Word, complete with macros for dynamic data updates. These templates are automatically populated with the latest data, simplifying recurring reporting tasks and ensuring accuracy.
Other Modules and Functionality: Add-Ons and Plugins
Recognizing the importance of integration, ClicData introduces several tools to connect its platform with other popular analytics and visualization applications.
Interactive Data Forms
Originally introduced as a widget, our form module is now being expanded into a comprehensive new module for enhanced functionality. This updated form module enables both structured form-based data entry and grid-like or tabular data entry directly within dashboards. It supports single and multi-record updates, streamlining data collection and integration processes.
Additionally, the module includes advanced validation rules for dynamic interactions, such as filtering dropdowns based on prior selections. With fully customizable designs, it offers flexibility while ensuring seamless integration with existing workflows.
New Plugins
- The Power BI plugin allows analysts to access ClicData datasets directly within Power BI, combining the strengths of both platforms.
- The WordPress plugin simplifies embedding dashboards and widgets into websites, enhancing data sharing and collaboration.
Looking Ahead: Realizing the Vision for 2025
Our 2025 roadmap is a testament to our dedication to empowering data analysts to do more, efficiently. By addressing challenges in data management, machine learning modeling, AI-driven analytics, automation and visualization, our platform ensures analysts can focus on delivering strategic insights with confidence.
As you prepare to leverage these innovations, stay informed through ClicData’s webinars and support channels. With these tools at your disposal, you’ll be ready to navigate the future of data analytics and collaboration with ease.
Looking forward to making 2025 another landmark year for our user community!