Marketing Reporting Tool & Dashboard Software for Mid-Market Agencies
Why ClicData is The Go-To Reporting & ETL Software For Marketing Agencies
Centralize performance data from advertising platforms, social media, customer relationship management (CRM) systems, email marketing tools, and web analytics into a single business intelligence (BI) platform–as opposed to calculating metrics in one tool and building dashboards in other tools, like Looker.
Connect your clients' campaign, lead, revenue, and budget data into a single marketing analytics platform. ClicData allows you to standardize KPIs across clients, blend ad spend with conversions or revenue, and build cross-channel marketing reporting dashboards that clearly demonstrate business impact.
The result of using ClicData?
✔ Measurable ROI visibility.
✔ Scalable operations for growing agencies.
Marketing Agencies We Work With

The 4 Reporting Problems Marketing Agencies Face
Yet for many agencies, reporting becomes a bottleneck.
Campaign data is spread across ad platforms, social media, CRMs, email systems, analytics tools, and Excel.
Pulling it together by hand eats into every reporting cycle.
Each platform calculates ROAS, CPA, revenue attribution, and conversions differently.
Without proper ETL, those numbers are nearly impossible to reconcile.
"I'm maintaining dashboards in Looker for every client, it's become unmanageable."
How does your agency scale when your best technical people are stuck duplicating and maintaining reports?
Clicks and impressions alone don't justify your retainer.
Your clients want to understand pipeline contribution, revenue influence, and clear return on their marketing investment.
How ClicData Solves Those Performance Reporting Problems


From channel metrics to client-ready ROI storytelling


From limited platform metrics to advanced client reporting


From generic dashboards to white-label client reporting
3 ClicData Features that Marketing Agencies ❤️

Native connectors to all your clients' data

Personalized & engaging reports

Fully automated
data & dashboards
Marketing Dashboards & Reports You Can Deliver
With ClicData, you can build and deliver structured marketing dashboards and automated marketing reports tailored to each client’s goals.


Ready to use Dashboard Templates
How Does The Agency Reporting Workflow Look Like in ClicData?
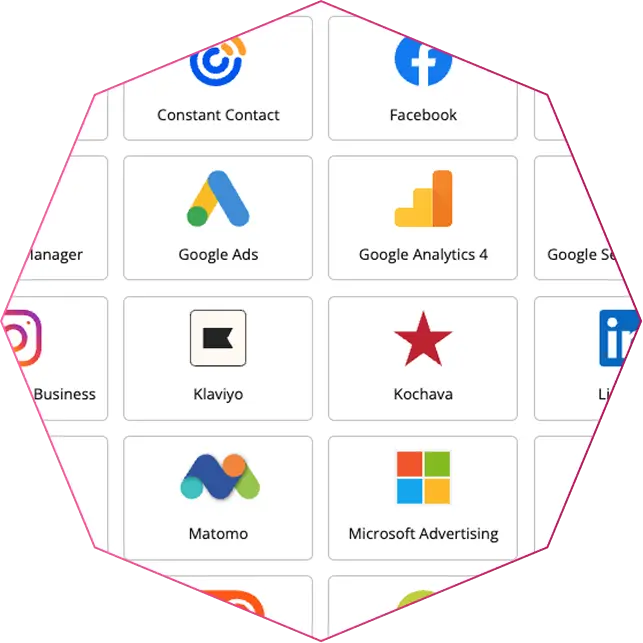
Use Smart Connectors to link CRMs, social media, advertising platforms, web analytics tools, and budget files.
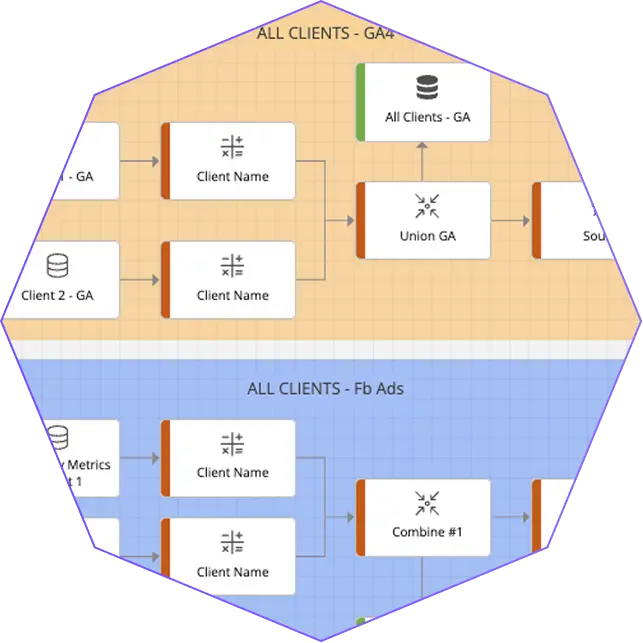
Build visual data flows to clean and standardize data, do custom calculations or advanced data tranformations.
Go beyond native platform metrics and build the KPIs that matter to your clients.
Automate data updates across channels and receive notifications when campaign objectives are reached.

Jennifer Marino

We Are The BI Tool That Makes You Look Good


Questions?
What is a marketing dashboard?
A marketing dashboard is a centralized, visual interface that pulls data from all your active channels — paid ads, organic search, social media, email, CRM, and more — into one unified view. Instead of logging into Google Ads, then Meta, then GA4, then your client’s HubSpot, you get a single pane of glass that shows what’s actually happening across the entire funnel.
But a good marketing dashboard isn’t just a pretty screen. It’s interactive. Your team (and your clients) can filter by date range, campaign, channel, or audience segment. They can drill into a spike in CPC or a drop in MQL-to-SQL conversion without waiting for someone to pull a spreadsheet. In ClicData, dashboards are built on top of a real data warehouse, which means you’re not limited to the canned metrics each platform gives you — you can create calculated fields, blend sources, and surface the KPIs that actually drive decisions.
Can I automate marketing reports for clients?
Absolutely, and this is where agencies reclaim serious hours every month.
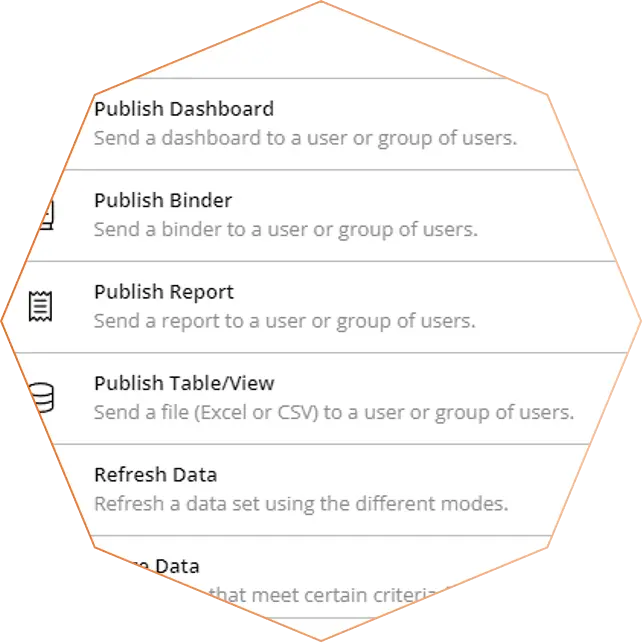
ClicData’s scheduling engine lets you automate the entire reporting pipeline. You configure a schedule (daily, weekly, monthly, specific days and times, up to six times per day), and ClicData handles the rest: refreshing your data connections, executing any data flows or transformations, caching views and merges, and then distributing the output. Reports can be automatically emailed as PDFs, PowerPoint decks, or images — or you simply share a Live Link that’s always up-to-date when your client opens it.
You can chain multiple tasks inside a single schedule: refresh five data sources, run a data flow to blend them, cache the result, then email the dashboard, all without touching it. Once it’s set up, your Monday morning client report builds itself on Sunday night.
How does white-label client reporting work?
White-label in ClicData goes well beyond slapping your logo on a PDF. It’s a full rebrand of the platform itself.
You can remove every mention of ClicData, customize the login page with your agency’s branding, use your own company domain (e.g., analytics.youragency.com), and send automated report emails from your own email address. When a client logs in or opens a Live Link, the entire experience looks and feels like your proprietary analytics platform.
Under the hood, you still get the full power of ClicData: 500+ connectors, data flows, interactive dashboards, scheduling, but your client never sees any of it. You can embed dashboards directly into your own web portal or client app via iframe, pass parameters for client-specific filtering, and control everything through the API if you want full backend automation. It’s how agencies like Marketri and MO&JO deliver a premium, branded analytics experience without building anything from scratch.
Do you support budget pacing and target monitoring?
Yes. This is a use case agencies build frequently in ClicData.
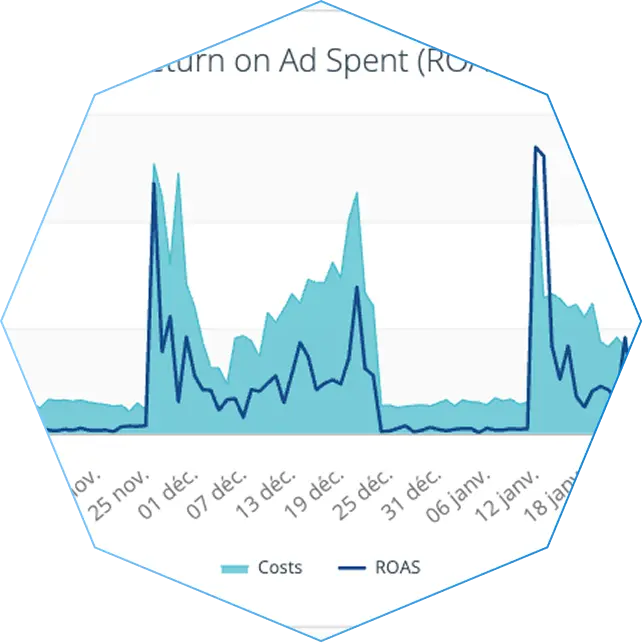
You can create pacing dashboards that compare actual spend (or impressions, leads, conversions, whatever the KPI) against planned targets over time. Using calculated fields in your data flows, you build formulas like Actual Spend to Date / Planned Spend to Date × 100 to show pacing percentage, then visualize it with gauges, progress bars, or trend lines.
ClicData also offers automated notifications triggered when a metric crosses a threshold. So if a client’s campaign is pacing 20% under budget at the midpoint, or CPA spikes above target, you can get an email or SMS before anyone has to check a dashboard. Combine that with automated data refreshes, and you’ve got a near-real-time early warning system for every campaign you manage.
Can I combine ad spend with CRM or revenue data?
This is one of the highest-value things you can do in ClicData, and it’s exactly where most point-solution reporting tools fall short.
Because ClicData has native connectors for ad platforms (Google Ads, Meta Ads, LinkedIn Ads, TikTok Ads, etc.) and CRMs and business systems (HubSpot, Salesforce, NetSuite, Shopify, etc.), you can pull both sides of the equation into the same data warehouse. Then, using data flows, ClicData’s visual ETL tool, you join, transform, and calculate the metrics that actually matter: true cost-per-acquisition tied to closed revenue, marketing-attributed pipeline, ROAS based on actual sales (not just pixel conversions), and customer lifetime value by acquisition channel.
The result? You stop reporting on what marketing did and start reporting on what marketing made. That’s the conversation that retains clients.
How do agencies manage reporting across multiple clients?
This is an operational challenge every growing agency faces, and ClicData is built for it.
Each client’s data lives in your centralized data warehouse but stays logically separated. You create dedicated connections, tables, and dashboards per client, and ClicData’s folder structure and security model let you organize and permission everything cleanly. Teams and roles mean your account managers only see their clients’ assets, not everyone else’s.
The real scale advantage comes from templating. Build a dashboard or report once — say, a standard paid media performance report — then duplicate it for each new client and simply rebind the data source. Combined with binders (packaged collections of dashboards you deliver as one unified report), white-label branding, and automated scheduling, you can onboard a new client’s reporting in hours, not days. Agencies using ClicData routinely manage dozens of clients from a single account without the operational overhead ballooning.