A bullet chart is a compact KPI visualization that compares a single measure against a target, along with performance thresholds. Developed by Stephen Few, it’s designed to replace dashboard gauges while using minimal space.
Key Components
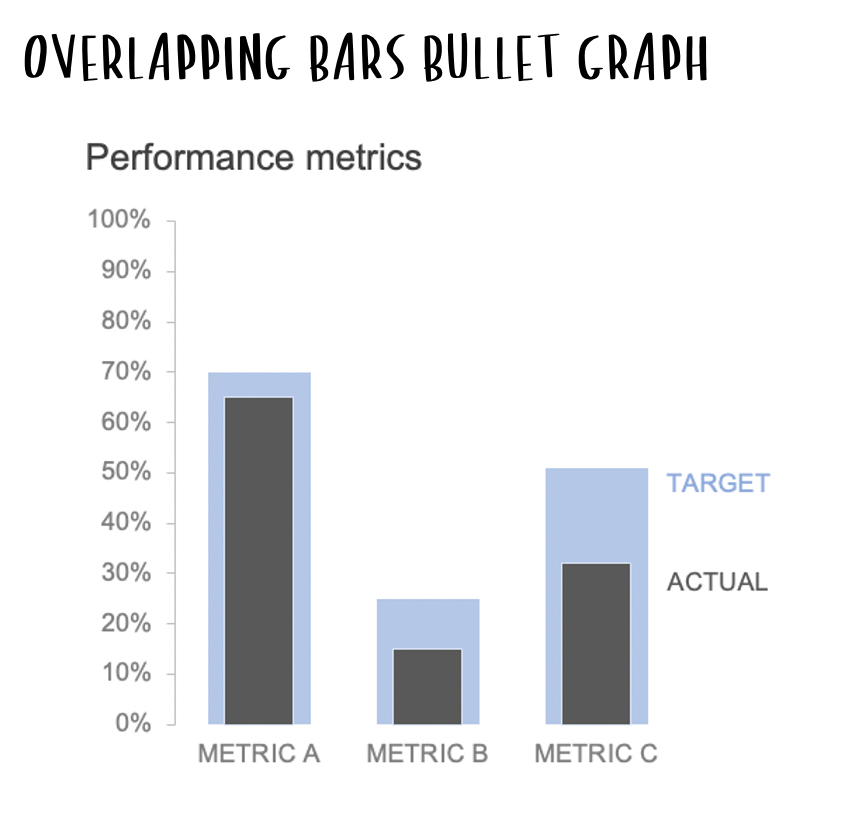
- Performance bar: The actual value
- Target marker: A vertical line showing the goal
- Background ranges: Color bands representing performance levels (e.g., poor, average, good)
When to Use Bullet Charts
- Track progress toward targets
- Display KPIs efficiently in compact dashboards
- Compare performance across multiple business units
Best Practices
- Keep it simple — avoid adding more than one metric per bullet
- Use subtle color gradients for qualitative ranges
- Label clearly to avoid ambiguity
Bullet Charts in ClicData
- Define thresholds, targets, and actual values visually
- Apply conditional formatting to performance ranges
- Use in KPI dashboards for executives or team leads
FAQ Bullet Chart
What’s the difference between a bullet chart and a gauge chart?
While gauge charts use circular dials, bullet charts are linear and much more space-efficient. They allow easier comparison of multiple KPIs side by side, making them better suited for compact, data-dense dashboards.
Can I display multiple metrics in one bullet chart?
It’s not recommended. Bullet charts work best when focused on a single KPI. Displaying multiple metrics in one chart can confuse users and defeat the chart’s clarity and purpose.
How should I define the performance ranges (qualitative bands)?
Set ranges based on your business logic or historical benchmarks. For instance: below 60% (poor), 60–85% (average), 85–100% (good). These bands provide instant visual feedback on how the metric is performing.
Which KPIs are best suited for bullet charts?
KPIs that track progress against a target, such as revenue, margin, churn rate, or conversion rate per department, product, or team. Bullet charts are ideal for quick performance assessments.
How do I handle multiple dynamic thresholds across different entities in a bullet chart?
When each business unit or product line has distinct performance ranges and targets, a static bullet chart structure can quickly break down. To solve this, link your bullet chart components (actuals, targets, and thresholds) to data-driven rules — for example, by storing thresholds in a reference table per entity and joining it to your KPI dataset in the data model. In ClicData, this can be managed via Data Flow merges or SQL views. This ensures the chart dynamically reflects correct performance bands for each context without hardcoding values, especially critical in enterprise dashboards.