All connectors > M-Files

M-Files

Connect files and data from M-Files to ClicData and build custom, fully automated and interactive dashboards.

mfiles logo

ClicData + M-Files

Get data from M-Files in minutes with our connector

Connect and unify data from any source

Instantly connect all your M-Files data to 250+ applications, systems, databases, or files, on-premise or in the cloud. Clean, transform, and forecast your data for a single source of truth.

Customize & automate your reporting

Go beyond M-Files analytics to visualize any KPI in custom and fully interactive dashboards, or pixel-perfect reports. Automate data updates, alerts, and publication to focus on what matters.

Share insights that drive business impact

Power decision-making at all times with fresh, reliable, and accessible data. Automatically send dashboards & reports to your teams, clients, and stakeholders, so everyone’s aligned.

How to connect M-Files to ClicData?

animated connectors
  • 1 Set up your connection
    Simply create a connection between your system and ClicData in just a few clicks.
  • 2 Get the structured data you need
    Select which data table you want to pull and ClicData will pre-format and load it for you.
  • 3 Transform, visualize, and share your data
    Clean, merge, and filter your data. Visualize it in custom dashboards or reports, and share it with your teams, clients, or stakeholders.

What benefits can you get?

  • Invoice and payment tracking for Accounting
  • Contract management and tracking for Professional Services
  • New employee onboarding tracking for HR
  • Project status and progress tracking for Project teams
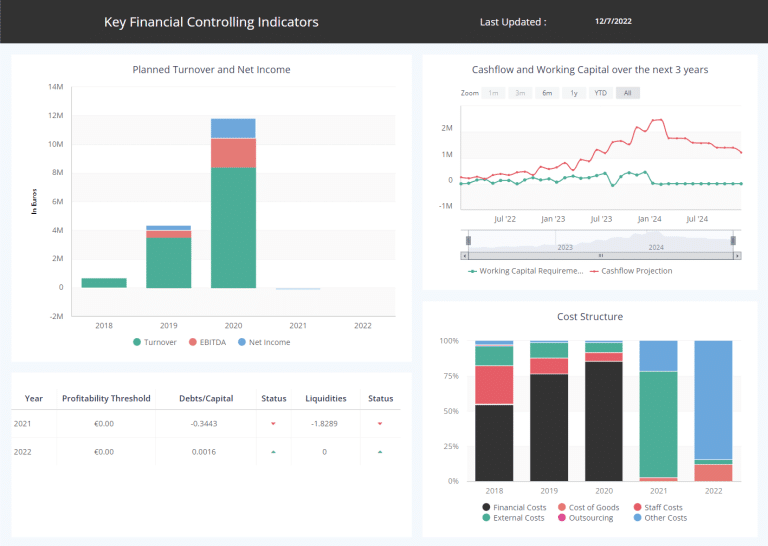
What can you measure?

  • Account Payable / Receivable
  • Billable Hours Per Account
  • New Hires / Employee Churn
  • Project Cost / Team Utilization / Profit by Account

Integrate all your company systems and enrich your analytics

salesforce-logo

Salesforce

netsuite logo

NetSuite

oracle logo

Oracle

FAQ

ClicData offers you more flexibility for your reporting needs, in multiple ways:

  • store historical data to perform YoY analysis and comparisons over time
  • clean, transform, calculate, forecast, and enrich your data with 250+ sources
  • build custom metrics and visualizations that answer key business questions