Your CEO asks how the business is doing.
You say, “Great.” Then comes the follow-up: “Compared to what?”
Last month? Last year? Since January 1st? Same quarter twelve months ago? Each answer points to a completely different number, and each one tells a different story about your business. Without the right framing, “we grew 15%” is meaningless; it could be a victory or a disaster depending on the comparison.
This is exactly what reporting acronyms like YTD, YoY, MTD, MoM, and QTD are built for. They are not jargon for the sake of jargon. Each one is a precise, time-bound lens for looking at performance. Pick the wrong one, and you’ll either celebrate a fluke or panic over a seasonal dip. Pick the right one, and you’ll spot trends weeks before they show up in the bottom line.
In this guide, you’ll learn what each acronym actually means, how to calculate them without getting tripped up by the two different formulas floating around the internet, when to use which, and what the most common mistakes look like in real dashboards.
Key Takeaways
- YTD, MTD, and QTD are to-date metrics. They measure cumulative performance from the start of a period (year, month, or quarter) up to today.
- YoY and MoM are comparison metrics. They compare a completed period against the same period before it, usually expressed as percentage growth.
- YTD has two formulas that are often confused: one is a cumulative sum (used for revenue, sales, leads), the other is a percentage return (used for investments). Mixing them up is the most common reporting mistake.
- YoY is often the preferred metric for high-level growth tracking because it helps reduce the noise caused by seasonality. MoM is the gold standard for spotting short-term changes, but it’s volatile.
- QTD bridges the gap between MTD and YTD, and is especially important for businesses using fiscal quarters that don’t align with calendar quarters.
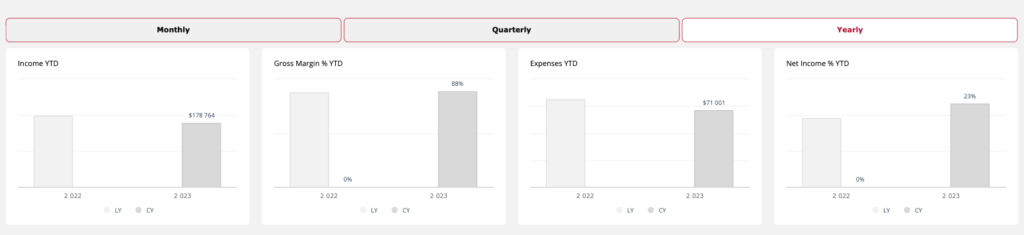
The 5 Reporting Acronyms at a Glance
Before we go deep on each one, here’s the full set side by side.
| Acronym | Stands For | Period Covered | Type | Best Used For |
|---|---|---|---|---|
| YTD | Year-to-Date | Jan 1 (or fiscal year start) → today | Cumulative / Return | Annual progress vs. plan, investment performance |
| QTD | Quarter-to-Date | Quarter start → today | Cumulative | Quarterly pacing, board reports |
| MTD | Month-to-Date | Month start → today | Cumulative | Short-term campaign tracking, monthly pacing |
| YoY | Year-over-Year | This period vs. the same period last year | Growth % | Long-term trends, seasonality-adjusted growth |
| MoM | Month-over-Month | This month vs. last month | Growth % | Spotting fast changes after a strategy shift |
The pattern is consistent: anything ending in “-to-Date” is cumulative inside the current period. Anything ending in “-over-” compares two completed periods.
YTD (Year-to-Date): What It Means and How to Calculate It
What YTD actually stands for
YTD is short for Year-to-Date. It refers to the period that starts on the first day of the current calendar year, or fiscal year, and runs through the latest finalized reporting date. In many business dashboards, that means yesterday rather than today, because the current day’s data is still incomplete
The two YTD formulas (and when to use which)
This is where most articles online get sloppy and lump everything together. There are actually two distinct YTD calculations, each answering a different question.
Formula 1 — YTD as a cumulative total (used for revenue, sales, leads, costs, anything you sum up):
YTD Total = Sum of values from Jan 1 → today
If your monthly revenue is $55,450 (January) + $87,690 (February) + $50,460 (March) + $40,600 (April so far), your YTD revenue is $234,200. That’s it. No percentages, no division. Just the running total.
Formula 2 — YTD return (used for investments, portfolio performance, stock prices):
YTD Return (%) = ((Current Value − Starting Value) ÷ Starting Value) × 100
If your portfolio was worth $300,000 on January 1 and is worth $450,000 today:
((450,000 − 300,000) ÷ 300,000) × 100 = 50% YTD return
The first formula tells you the cumulative amount. The second tells you the percentage change from a starting value. They are not interchangeable. Reporting “YTD revenue of 234%” when you mean “$234,200” is a common dashboard mistake.
When to use YTD
YTD is your friend when you need to answer questions like:
- “How are we doing against our annual revenue plan?”
- “What’s the total pipeline we’ve built since January?”
- “Are we on pace to hit our fundraising target by December?”
Because it spans a longer time window than MTD or QTD, it smooths out short-term noise. A bad week barely moves the YTD number once you’re past the first quarter. That makes it ideal for strategic, planning-level decisions rather than tactical adjustments.
YTD in different industries
YTD shows up in nearly every business context, but the language changes:
- In sales, YTD usually means total bookings or closed-won revenue since January 1.
- In banking and finance, YTD typically refers to interest earned, fees collected, or portfolio performance from the start of the year.
- In hospitality, YTD often tracks total occupancy, ADR (average daily rate), or RevPAR since the start of the fiscal year.
- In payroll, your YTD earnings on a pay stub show everything you’ve earned this calendar year: gross pay, taxes withheld, and deductions.
The formula is the same. The metric is what changes.
MTD (Month-to-Date): Tracking the Current Month
What MTD actually stands for
MTD stands for Month-to-Date (sometimes written month-till-date, though month-to-date is far more common). It works exactly like YTD, just on a smaller scale: from the first day of the current month through today, excluding today.
If today is March 22, your MTD covers March 1 through March 21.
The MTD formulas
Same dual structure as YTD:
MTD as cumulative total:
MTD Total = Sum of values from the 1st of the month → today
A debt collection agency starts the month having already collected $1.5M (the running total from previous months stays put). By March 15, this month’s new collections total $500,000. That’s the MTD collection for March.
MTD growth/return percentage:
MTD Change (%) = ((Current MTD Value − Starting Value) ÷ Starting Value) × 100
Use the second form when you want to express MTD as a percent change rather than a raw total.
MTD in different industries
MTD is one of the most commonly used reporting terms in sales, finance, banking, hospitality, and retail.
- MTD in sales — total revenue, units sold, or deals closed since the first of the month. It’s how sales managers spot whether the team is pacing toward quota.
- MTD in banking — typically deposits, withdrawals, fees, or interest from the start of the month. Useful for branch-level performance reports.
- MTD in the hotel industry — month-to-date occupancy, room nights, or revenue. Particularly important during high seasons when daily fluctuations matter.
- MTD in retail — same-store sales since the first of the month, foot traffic, or units sold per category.
- MTD in corporate reporting — almost always refers to financial performance: revenue, expenses, or operating margin from the start of the month.
When to use MTD
MTD is your tactical lens. It answers:
- “Are we on pace this month, or do we need to push harder this week?”
- “Did that promo we launched on the 1st actually move the needle?”
- “How does our cost-per-acquisition this month compare to last month at the same point?”
That last question is critical and often missed. Comparing today’s MTD against last month’s MTD on the same day is far more useful than comparing this month’s running total against last month’s final total. The full-month figure includes 30 days; your MTD might only cover 15.
The limits of MTD
Because the window is short, MTD is volatile. A single big customer, a slow Monday, or a long weekend can swing the number dramatically. Most experienced analysts treat MTD as an early-warning signal, not a verdict useful for catching problems fast, dangerous for drawing long-term conclusions.

QTD (Quarter-to-Date): The Bridge Between MTD and YTD
What QTD actually stands for
QTD is Quarter-to-Date. It covers the period from the first day of the current quarter through today, excluding today.
If today is May 10, you’re in Q2, so QTD covers April 1 through May 9.
Standard vs. fiscal quarters
There are two flavours of “quarter” you need to be aware of.
Standard calendar quarters:
- Q1: January, February, March
- Q2: April, May, June
- Q3: July, August, September
- Q4: October, November, December
Fiscal quarters are the same three-month structure, but shifted to align with a company’s fiscal year. The U.S. federal government, for example, starts its fiscal year in October so October, November, and December are its Q1. Retailers with heavy holiday seasons often shift their fiscal year to end in late January, so the December peak sits cleanly inside Q4 rather than straddling fiscal year-end.
When you’re building reports, always confirm which quarter definition the business uses. A “Q1 report” can mean very different periods depending on the company.
When to use QTD
QTD is most useful for:
- Board meetings and investor updates (which almost always run on quarterly cycles)
- Tax planning and quarterly filings
- Quarterly bonus and commission calculations
- Comparing pacing against quarterly targets
It’s also the right metric when MTD is too narrow (one bad week distorts everything) but YTD is too broad (a strong Q1 is hiding a weak Q2).
YoY (Year-over-Year): The Standard for Growth Reporting
What YoY actually stands for
YoY (also written Y/Y, YOY, or year-on-year) is short for Year-over-Year. It compares a metric in the current period to the same metric in the same period one year earlier. The “period” can be a full year, a quarter, a month, or even a single day.
The keyword is the same. Q3 2026 vs. Q3 2025. October 2026 vs. October 2025. The whole point is to remove seasonality from the picture.
The YoY formula
YoY Growth (%) = ((Current Period Value − Same Period Prior Year) ÷ Same Period Prior Year) × 100
Or, equivalently:
YoY Growth (%) = ((Current Period Value ÷ Same Period Prior Year) − 1) × 100
Both versions give the same answer. Use whichever feels more intuitive.
Worked example. A seasonal e-commerce store does $50M in revenue during the 2025 holiday season. The same store does $75M in 2026.
YoY = ((75 − 50) ÷ 50) × 100 = 50%
The business grew 50% year-over-year — for that specific season.
Why YoY is the gold standard
Here’s what makes YoY so powerful: it neutralizes seasonality.
Imagine you run a hotel chain. December is always your best month, May is your worst. If you compare December to May, December always wins, but that tells you nothing about whether the business is actually growing. Comparing December 2026 to December 2025 tells you something real. It strips out the predictable fluctuation and shows you the underlying trend.
That’s why YoY is the metric you’ll see most often in earnings reports, investor decks, and annual reviews. It’s also what executives default to when asked, “Is the business growing?” because it answers that question while reducing the distortion caused by seasonality.
When YoY breaks down
YoY isn’t perfect. Two things to watch for:
- The base-period effect. If last year was an outlier, exceptionally bad (think 2020 in travel) or exceptionally good YoY comparisons against that base look distorted. A 200% YoY recovery can just mean “we got back to normal,” not “we doubled the business.”
- Structural changes. YoY comparisons assume the business looks roughly the same as last year. If you acquired a company, sold off a division, or repositioned your pricing, the YoY number reflects both organic growth and structural change. Always footnote those.
MoM (Month-over-Month): The Tactical Growth Lens
What MoM actually stands for
MoM is Month-over-Month. It compares a metric for the current month to that of the previous month. Like YoY, it expresses change as a percentage.
The MoM formula
MoM Growth (%) = ((This Month’s Value − Last Month’s Value) ÷ Last Month’s Value) × 100
Example. A car dealership sells 30 vehicles in January. In February, sales jumped to 50.
MoM = ((50 − 30) ÷ 30) × 100 = 66.7%
That’s a strong jump. But, and this matters, it’s also wildly volatile.
The volatility problem
MoM is the most sensitive of the time-based metrics. A single big deal, a missed shipment, an extra weekend in the month, a holiday landing on a Monday vs. a Tuesday, any of these can swing a MoM number by 10% or more without anything meaningful happening in the business.
That’s why MoM is best used for operational decisions, not strategic ones. You wouldn’t restructure your sales team based on a single MoM number. But you might investigate why your conversion rate dropped 20% MoM after a website redesign.
When to use MoM
- Tracking the immediate impact of a campaign or product change
- Identifying acceleration or deceleration in fast-moving metrics (signups, trial conversions, ticket volume)
- Spotting an emerging trend before it shows up in quarterly numbers
Compound Monthly Growth Rate (CMGR)
For businesses that want to track sustained growth over several months without the volatility of raw MoM, there’s a smoother metric: CMGR.
CMGR = (End Value ÷ Start Value)^(1 ÷ Number of Months) − 1
If the dealership grew from 30 cars in January to 48 cars in May (a 5-month window):
CMGR = (48 ÷ 30)^(1 ÷ 5) − 1 = 0.0986 = 9.86%
That means the business grew an average of 9.86% per month, compounded, over those five months. Far more reliable than a single MoM number, especially for fast-growing companies tracking subscriber growth, MRR, or active users.
YoY vs. MoM vs. QoQ: Same Logic, Different Time Windows
Once you understand the over- pattern, you can build other comparison metrics on the same template.
| Metric | Compares | Best For |
|---|---|---|
| MoM (Month-over-Month) | This month vs. last month | Fast feedback after operational changes |
| QoQ (Quarter-over-Quarter) | This quarter vs. last quarter | Mid-range trend analysis, less noise than MoM |
| YoY (Year-over-Year) | This period vs. the same period prior year | Strategic growth, seasonality removal |
QoQ deserves a mention because it sits in the sweet spot for many SaaS and B2B businesses: long enough to smooth out monthly volatility, short enough to catch issues before YoY would surface them.
When to Use Which: A Decision Guide
| If you’re asking… | Use this metric |
|---|---|
| “How are we tracking against our annual plan?” | YTD (cumulative total) |
| “Are we on pace this month?” | MTD |
| “How’s the quarter shaping up for the board meeting?” | QTD |
| “Is the business actually growing year over year?” | YoY |
| “Did our recent change have an immediate effect?” | MoM |
| “What’s the smoothed growth rate over the last 6 months?” | CMGR |
| “Is our investment portfolio up or down this year?” | YTD return (percentage formula) |
| “How did Q3 2026 compare to Q3 2025?” | YoY (applied to the quarter) |
Industry-Specific Examples
These acronyms span nearly every industry, but the metrics they’re applied to vary.
Marketing agencies. YTD pipeline contribution, MTD ad spend pacing, YoY brand search volume, and MoM CPL (cost-per-lead) after a creative refresh.
Retail and e-commerce. MTD same-store sales, QTD inventory turnover, YoY holiday season revenue, and MoM average order value during a promo.
Hotels and hospitality. YTD RevPAR, MTD occupancy, YoY ADR during shoulder season, and MoM direct booking share after a website redesign.
SaaS. MTD new MRR, QTD net revenue retention, YoY ARR growth, and MoM trial-to-paid conversion rate.
Banking and financial services. YTD fee income, MTD deposit growth per branch, YoY net interest margin, and MoM loan origination volume.
The pattern is the same in every industry: the to-date metrics tell you where you are inside the current period, the over metrics tell you how you’re doing relative to a past period.
Common Mistakes to Avoid
A few traps that show up in dashboards constantly:
- Mixing the two YTD formulas. Reporting “YTD revenue grew 234%” when you actually mean “$234,200 in YTD revenue” and vice versa. Always be explicit about whether you’re showing a total or a return.
- Comparing this month’s MTD to last month’s full total. If today is the 15th, comparing 15 days of this month to 30 days of last month makes this month look catastrophic. Always compare like-for-like: today’s MTD vs. last month at the same day count.
- Ignoring leap years and unequal months. February has 28 or 29 days. A YoY comparison of February 2024 (29 days) vs. February 2025 (28 days) includes a built-in 3.6% headwind unrelated to business performance.
- Using MoM for strategic decisions. A single MoM number is noisy. Restructuring a team or killing a product because of one bad month is how good initiatives get cut prematurely.
- Forgetting fiscal vs. calendar. A Q1 report from a federal contractor (fiscal year starting October) is not comparable to a Q1 report from a calendar-year company. Always confirm the fiscal calendar before you compare.
- Treating YoY as bulletproof. YoY removes seasonality but not structural change. A 50% YoY jump after an acquisition isn’t 50% organic growth.
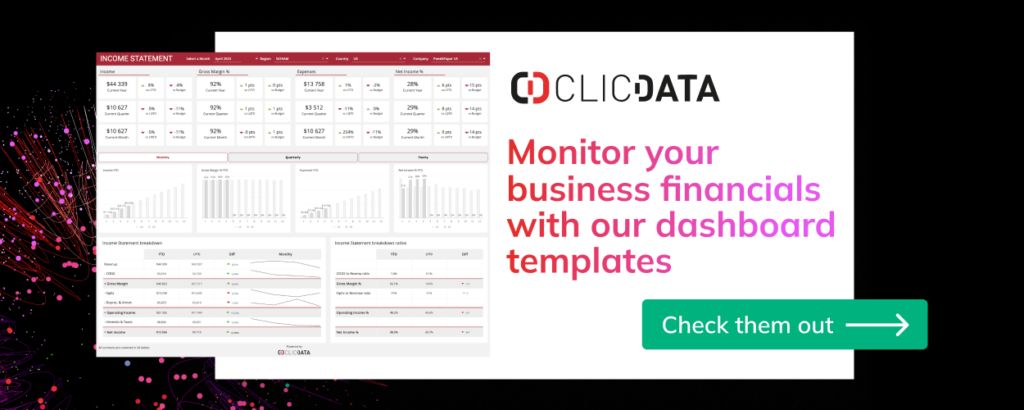
How ClicData Handles Time-Based Reporting
These calculations are simple in theory. They get messy when you’re pulling data from twelve different platforms, each with its own date formats, time zones, and definitions of “month-end.”
ClicData is built to handle exactly that. You connect your data sources, sales, marketing, finance, CRM, ad platforms, and everything lands in a single warehouse where dates are standardized and time-based calculations work the way you’d expect.
A few things that make YTD/MTD/YoY/MoM reporting much easier inside ClicData:
- Data Flow — a visual ETL designer where you can build calculated fields for YTD totals, MoM growth, YoY comparisons, and CMGR without writing code. Drag, connect, calculate.
- Calculated fields and formulas — define your YTD logic once in the warehouse, and every dashboard pulling from that dataset stays consistent. No more “but Sarah’s report shows a different YTD number than mine.”
- Snapshots — automatically save point-in-time versions of your datasets so you can build comparison dashboards (today’s MTD vs. last month at the same day, this year’s QTD vs. last year’s same QTD) without manual data wrangling.
- Scheduler — refresh your time-based metrics daily, hourly, or in near real time so MTD dashboards are always current when someone opens them on Monday morning.
- Comparison widgets — built-in dashboard components for showing current vs. prior period side by side, with automatic percentage change calculations.
Whether you’re tracking pipeline pacing for the sales team, monthly KPI movement for the leadership group, or year-over-year growth for the board deck, ClicData gives you the infrastructure to define your time-based metrics once and reuse them everywhere.
Want to see it in action? Book a personalized demo, and we’ll show how a YTD, MTD, YoY, and MoM reporting dashboard could work with your own business data.
Frequently Asked Questions
YTD stands for Year-to-Date. It refers to the period from the first day of the current year (calendar or fiscal) up to today, typically excluding the current day. YTD can be expressed either as a cumulative total (used for revenue, sales, and other summed metrics) or as a percentage return (used for investments and portfolio performance).
In a sales context, MTD (Month-to-Date) refers to total sales activity since the first day of the current month. That could mean revenue, units sold, deals closed, or pipeline created. Sales managers use MTD to track whether the team is pacing toward the monthly quota and to spot underperformance early enough to address it.
MTD in banking stands for Month-to-Date, the same as in any other industry. In banking specifically, it’s most often used to track deposits, withdrawals, fee income, interest earned, or loan originations from the first day of the current month through today. Branch managers and regional leaders use it to monitor day-to-day pacing against monthly targets.
YTD measures cumulative performance from the start of the current year through today. It’s a running total within a single period. YoY compares a completed period (a full year, a quarter, a month) against the same period one year earlier; it’s a comparison between two periods. Put differently: YTD answers “how much have we done so far this year?” while YoY answers “how does this period compare to a year ago?”
Both are cumulative to-date metrics, just at different scales. MTD runs from the first of the current month to today. YTD runs from the first of the current year (or fiscal year) to today. MTD is for tactical, short-term tracking. YTD is for strategic, annual planning.
The formula is: ((This Month’s Value − Last Month’s Value) ÷ Last Month’s Value) × 100. If revenue this month is $50,000 and last month was $40,000, your MoM growth is (50,000 − 40,000) ÷ 40,000 × 100 = 25%.
QTD stands for Quarter-to-Date, the cumulative total from the start of the current quarter through today. It sits between MTD and YTD in scope, and it’s especially useful for businesses that report on quarterly cycles, such as public companies or organizations with quarterly bonuses and commission structures.
It depends on the question. YoY is better for strategic, long-term growth analysis because it cancels out seasonality. MoM is better for tactical and operational decisions because it gives you immediate feedback on changes. Most analysts use both: YoY for the board deck, MoM for the team standup. The mistake is using one when the other would be more accurat
Usually not. YTD typically runs through the end of the previous business day because today’s data isn’t finalized yet. The same convention applies to MTD and QTD. If you need today’s numbers explicitly, look for metrics labelled “as of [today]” or “real-time” rather than YTD.