Plans & PricingSignup for Free

ClicData Update 3.8

By Telmo Silva on November 27, 2013

Hi there ClicData Users!

We have just updated ClicData once again with a new release absolutely PACKED with new features

  •  ClicData API v1

Our Tech savvy  users can now start using our API to integrate ClicData directly within their own applications.

The whole API documentation can be found here: **

(You need a paying subscription to use the ClicData API)

  • New data connector: BaseCamp

Basecamp is a cloud based application that helps you manage multiple projects at a time with to-do lists, file sharing, chatting, messages, calendars and time tracking.

If you are already a basecamp user, you can now directly connect your Basecamp data to ClicData with our new connector! If not, we highly suggest you try out Basecamp for free, it’s a really good at what it does!

basecamp logo

  • New widgets: Waterfall and Radar charts

Every update, we add a few new visual indicators, for update 3.8 we’ve introduced the Waterfall and Radar charts:

radar chart clicdata

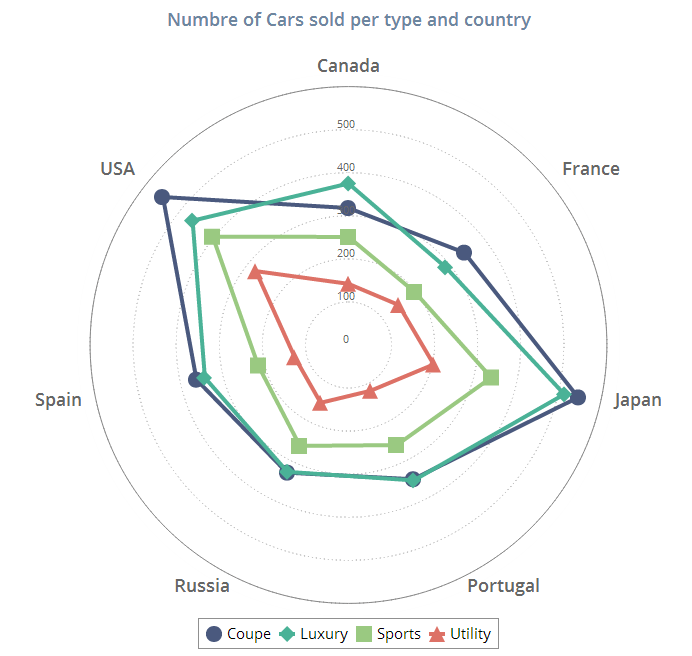
You can access those new widgets through the “advanced charts” icon in your widget toolbox.

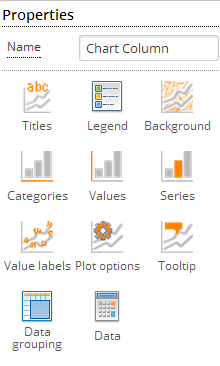
  • New Properties Panel for charts

We have introduced a brand new properties panel for your charts. You will now have the possibilities to set properties for absolutely EVERYTHING on your charts. Decide on the colors you want to use, the font of your tooltips, the position of the legend etc.

properties panel ClicData

Minor but still important updates:

  • When you importCSV files, you can now define culture for date & numbers
  • Improvements for Pie charts, you can now use series
  • Improvements to the Google Analytics.

The complete changelog is available here with a preview of what can be expected for next month 😉

Happy Dashboarding!

Table of Contents

Share this Blog

Other Blogs

Stop KPI Drift: SQL Reporting That Stays Consistent Over Time

Executives don't distrust your time series data because the SQL is wrong. The SQL is usually fine. The problem is that last quarter's numbers changed between the July board meeting…

Franchise Performance Dashboard: Managing Multi-Location Franchise Operations at Scale

Franchise alignment breaks down not because people don't understand the strategy, but because they can't see how it connects to their own performance metrics. That gap is the friction point…

Multi-Location Restaurant Analytics: How Franchises Stop Margin Leaks Before They Become Closures

Labor costs quietly climbing by 2% at one location. Over-portioning that nobody catches until the food cost report lands a month later. A store manager who's been struggling since April,…
All articles
We use cookies.
We use necessary cookies to make our site work. We'd also like to use optional cookies which help us improve our the site as well as for statistical analytic and advertising purposes. We won't set these optional cookies on your device if you do not consent to them. To learn more, please view our cookie notice.

If you decline, your information won't be tracked when you visit this website. A single cookie will be used in your browser to remember, your preference not to be tracked.
Essential Cookies
Required for website functionality such as our sales chat, forms, and navigation. 
Functional & Analytics Cookies
Helps us understand where our visitors are coming from by collecting anonymous usage data.
Advertising & Tracking Cookies
Used to deliver relevant ads and measure advertising performance across platforms like Google, Facebook, and LinkedIn.
Reject AllAccept