Plans & PricingSignup for FreeGet a demo

ClicData Feature Spotlight, Update 3.10

Telmo Silvaon January 28, 2014
Last updated on May 14, 2025

Hi ClicData Users,

This weekend, as our servers were down for an infrastructure upgrade, we took the opportunity to update ClicData!

So what is new with this version?

Drag & Drop… your Data!

You can now directly drag and drop your data in your dashboards to instantly create indicators!

Use the Data tab in your dashboard editor to Drag & Drop the source you want and ClicData will automatically offer you a selection of widgets based on your selection.

We’ve just made a quick video to show you how it works.

https://youtu.be/1OGPmeWtKsI

New Connectors on Free Trial

All accounts can now access our brand new connectors for free.
Try out our SurveyMonkey, BaseCamp and Google Spreadsheets connectors this month!

freetrial

You need to cross the results of a survey with another source of data? Transform your raw Data from Google Docs into nice visual indicators?

Now you can!

Don’t hesitate to let us know what you think about these, we pay a lot of attention to your feedback and will be happy to improve our connectors just the way you want!

New Widget Design

We have just rejuvenated some of our old widgets! Check out the new fully customizable gauge and click on the one below to test out some examples live.

gauge

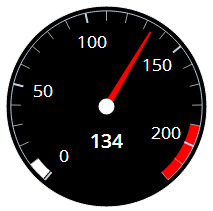
We also added brand new indicators, our old traffic light was feeling a bit lonely ;)

Full release notes is available here: https://www.clicdata.com/releasenotes

Happy Dashboarding!

Table of Contents

Share this Blog

Other Blogs

From BI to AI Analytics: What the Transition Actually Looks Like in Practice

In most mid-market companies, the BI half of the picture is the part that's settled: the dashboards refresh overnight, the Monday reports land in inboxes, and there's a tidy stack…

ABC Analysis in Inventory Management: How to Classify Your SKUs and Manage by Impact

You're managing 400 SKUs. You treat every product the same, same reorder triggers, same attention, same safety stock logic. Then one of your top-10 revenue products runs out on a…

Embedded Analytics for SaaS: How to Give Every Client Their Own Dashboard Without Building It In-House

Somewhere in the growth of most B2B SaaS products, customers start asking for the same thing: a way to see and report on their own data without leaving the app.…
All articles
We use cookies.
We use necessary cookies to make our site work. We'd also like to use optional cookies which help us improve our the site as well as for statistical analytic and advertising purposes. We won't set these optional cookies on your device if you do not consent to them. To learn more, please view our cookie notice.

If you decline, your information won't be tracked when you visit this website. A single cookie will be used in your browser to remember, your preference not to be tracked.
Essential Cookies
Required for website functionality such as our sales chat, forms, and navigation. 
Functional & Analytics Cookies
Helps us understand where our visitors are coming from by collecting anonymous usage data.
Advertising & Tracking Cookies
Used to deliver relevant ads and measure advertising performance across platforms like Google, Facebook, and LinkedIn.
Reject AllAccept