Hey There ClicData Users!
Holidays definitively won’t stop us from working! This month, aside from bug fixes and small tweaks to current features, we kept adding more functionalities to ClicData based on our beta users experience.
Let’s starts with improvements to our visualization widgets: (click on the screenshots to get the “full picture” ;) )
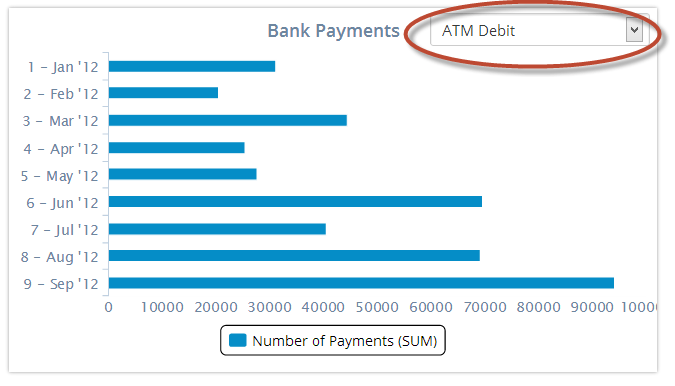
Auto Filter
We found that in our previous version our filter feature was a bit complicated, so we added new functionality to create filters in just a few clicks. Just select the filter you want to apply and we will automatically create a list widget to filter your indicator.
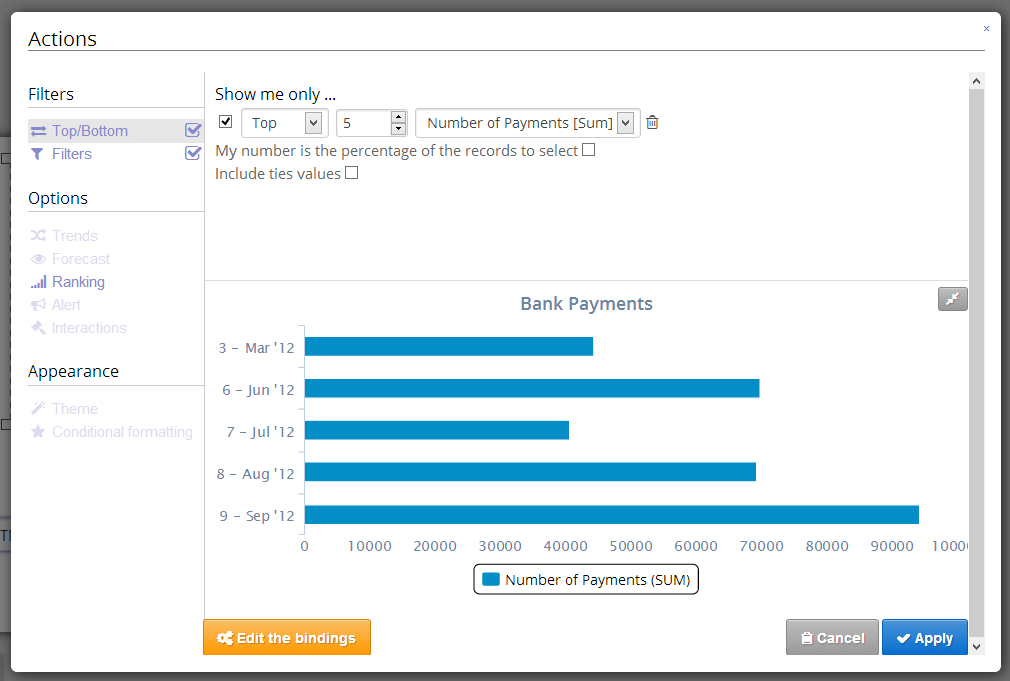
Top / Bottom
If you have a big set of data and you wish to only display the Top or Bottom values of your data set, you can now do so through the Top/Bottom feature.
Look and Feel
We have improved the overall look and feel of ClicData by adding new icons and changing the ergonomics on the data and dashboard menu, you will now be able to see your content through a list or thumbnails.
On the Data Management side we have a new connector:
The RSS feed
You can now import data from any RSS feed into ClicData. I’m sure you will find a lot of use for that and not just showing the latest favorite cat pictures from your favorite Tumblr ;)
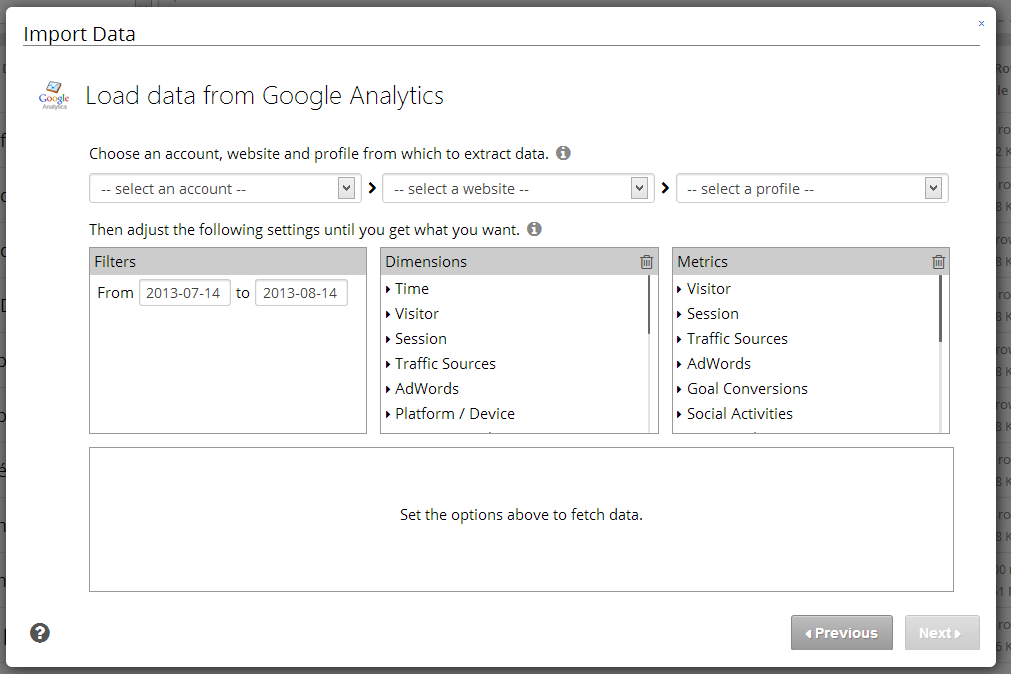
Google Analytics
The user experience with our google analytics connectors has been improved, we will continue to work on this one, don’t hesitate to give us your feedback on that specific connector.
Also, on a side note, our Billing system is now operational and you could upgrade your subscription if you wish to do so…
Do you know what that means?
The launch has never been closer ;)