Plans & PricingSignup for Free

ClicData i4, September Update

By Telmo Silva on September 16, 2015

More features for you in September!

Hi There ClicData Users,

This month of September is packed with new features! Here is a taste of what has just come out.
For more details on all the latest releases, simply have a look at our official i4 Status Page.
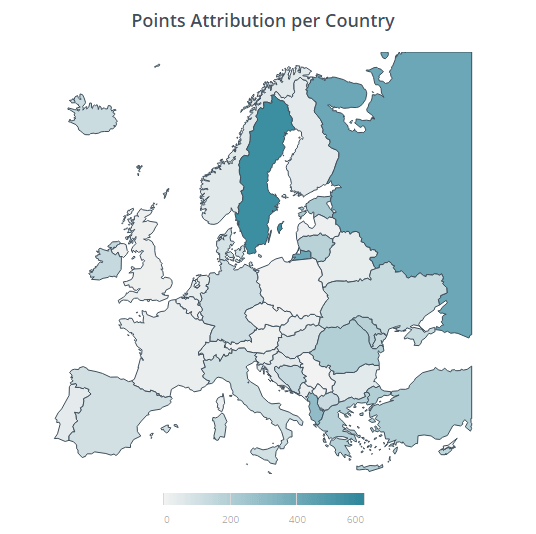
MAPS !
ClicData now allows you to visualize your data through maps! A very handy feature if you need to track your product performance across different regions for example, or to display statistics about certain epidemics’ evolution if you are working in this particular field.
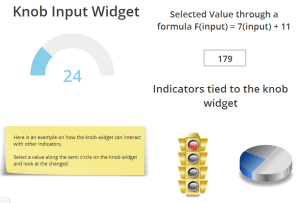
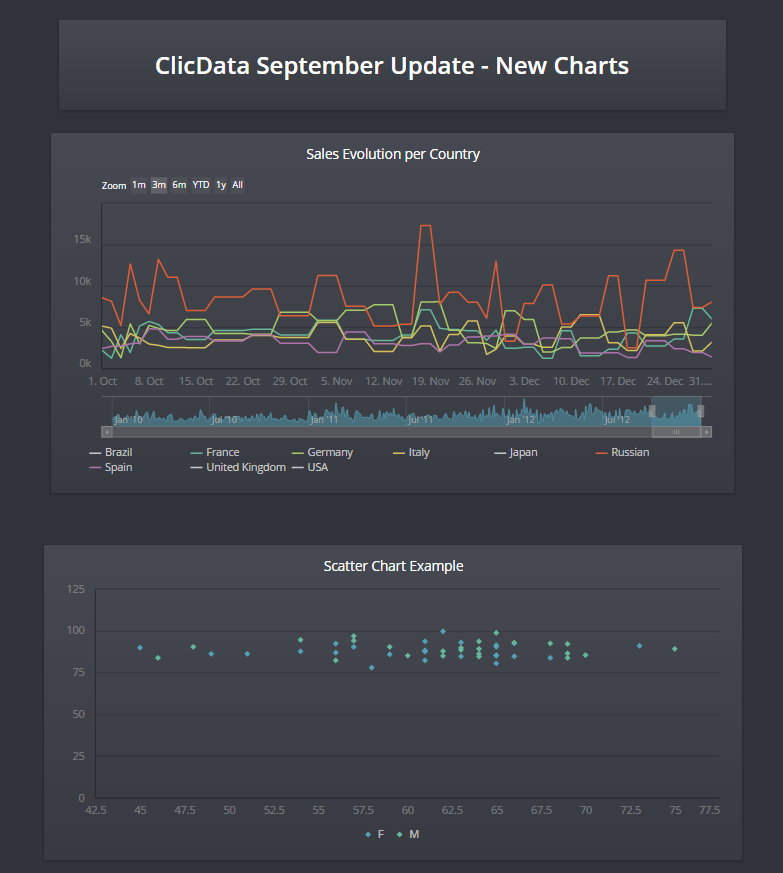
blogmaps
Click on the screenshot to try our new Map Widget

New Charts Type

  • Time Slider Charts
    We also keep adding charts widgets to ClicData! Time series data can be long and require analysis from both a high-level and a detailed view. The Time Series Slider widget displays values for only one attribute, which is usually time-based, to limit the amount of data viewed at one time.
  • Scatter Charts
    This type of chart will be particularly useful when trying to determine whether 2 variables are related for example when trying to identify potential root causes of problems. Try it anytime you need to display paired numerical data.
Click on the screenshot to see the new charts in full size
Click on the screenshots to see the new charts in full scale.

Maria DB
Maria DB has now been added to the long list of connectors available in ClicData. Many of our customers store their data in a Maria DB database. We created a connector so that the data import from Maria DB can be secured and automated. It now only takes a couple of steps.

Look out for our next update and keep sharing your feedback on the releases and what else you require for your dashboards.
Happy Dashboarding!

Table of Contents

Share this Blog

Other Blogs

A Chart Chooser for BI Teams: Stop Guessing, Start Deciding

The wrong chart doesn't just look bad, it changes what people believe the data says. When a trend appears flat on a pie chart or a comparison gets buried in…

Why AI Fails without Data Engineering

Industry reports suggest that as many as 80% of AI projects fail to deliver anticipated value. This failure rarely stems from the AI models themselves, but from fundamental issues such…

Stop KPI Drift: SQL Reporting That Stays Consistent Over Time

Executives don't distrust your time series data because the SQL is wrong. The SQL is usually fine. The problem is that last quarter's numbers changed between the July board meeting…
All articles
We use cookies.
We use necessary cookies to make our site work. We'd also like to use optional cookies which help us improve our the site as well as for statistical analytic and advertising purposes. We won't set these optional cookies on your device if you do not consent to them. To learn more, please view our cookie notice.

If you decline, your information won't be tracked when you visit this website. A single cookie will be used in your browser to remember, your preference not to be tracked.
Essential Cookies
Required for website functionality such as our sales chat, forms, and navigation. 
Functional & Analytics Cookies
Helps us understand where our visitors are coming from by collecting anonymous usage data.
Advertising & Tracking Cookies
Used to deliver relevant ads and measure advertising performance across platforms like Google, Facebook, and LinkedIn.
Reject AllAccept