
Dashboards & Reports
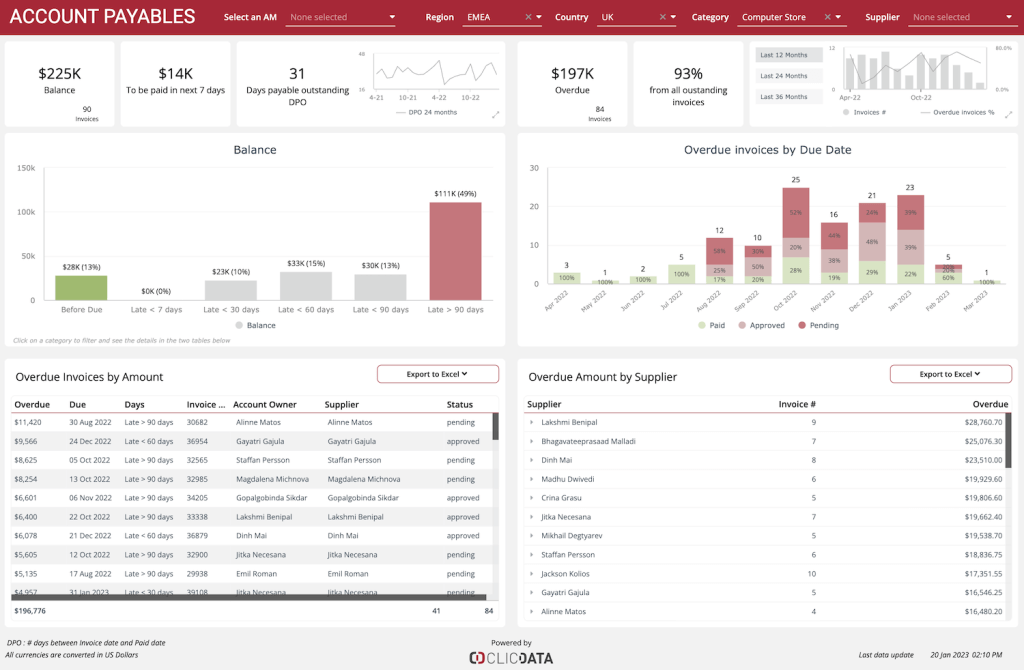
Account Payables
An accounts payable KPI (Key Performance Indicator) dashboard can be an essential tool for businesses to manage their financial health. This account payables dashboard template provides real-time data on a company’s accounts payable, which includes all outstanding bills that the [...]
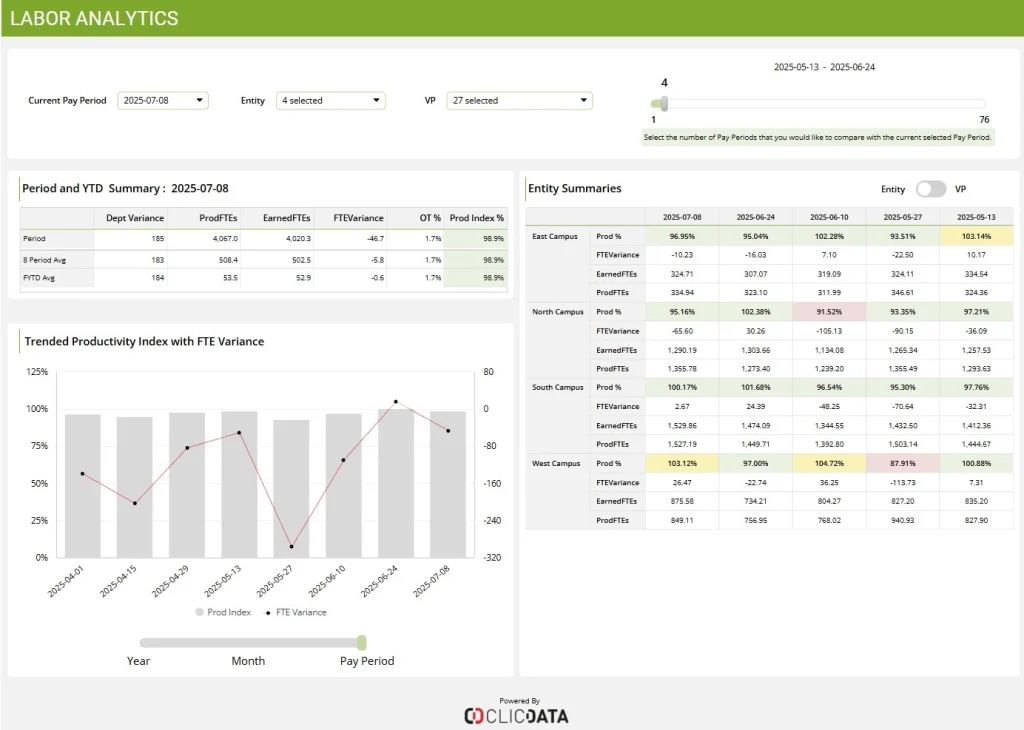
Healthcare Labor Analytics
This healthcare-specific Labor Analytics dashboard tracks workforce productivity, FTE variance, and overtime across medical campuses and departments. It helps identify staffing inefficiencies by comparing earned vs. produced FTEs and trending productivity indexes over time. Essential for healthcare operations leaders aiming [...]
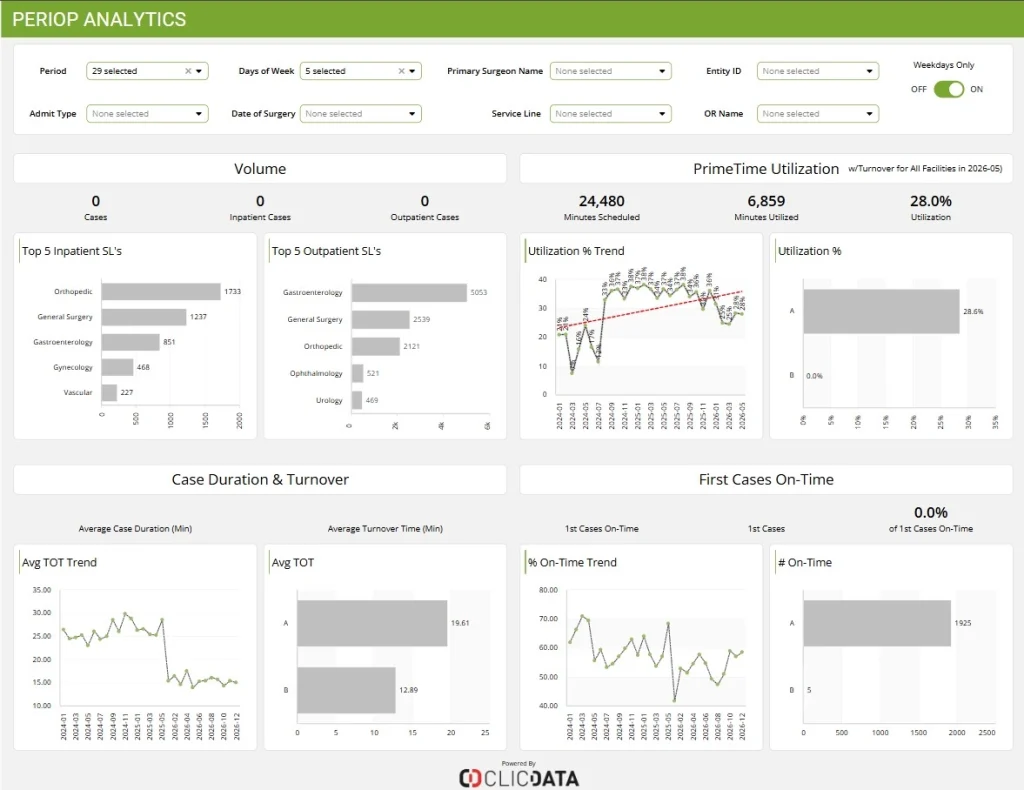
Periop Analytics
Periop Analytics provides visibility into surgical operations by tracking case volumes, utilization rates, turnover times, and on-time first case performance. With clear segmentation between inpatient and outpatient procedures, the dashboard helps uncover inefficiencies in OR scheduling and resource use. An [...]

Pharma Sales
Monitor your pharma sales performance by customer with quantities ordered, shipped, and delivered as well as a comparison between your revenue and target.

Pharma Sales Analysis
Get an overview of your pharma sales performance in this dashboard! Keep track of your quantity ordered, delivered, sold, and generated revenue. Filter by products, customers, and locations understand where you need to focus on.

Pharma Sales Force Analysis
Monitor your sales force effectiveness on a month-by-month basis with the number of rep visits, calls, and generated sales, all combined in a single dashboard. And the best thing is you can filter by year, month, rep, and location.
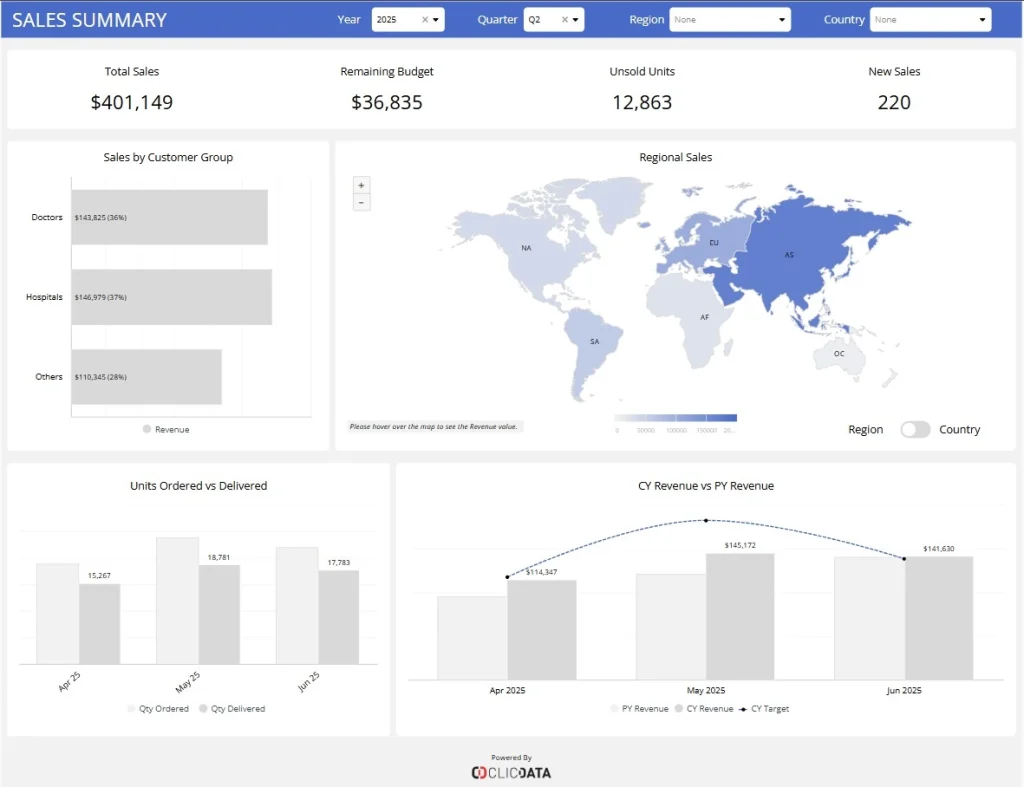
Pharma Sales overview
Track pharmaceutical sales performance with key metrics like total sales, new sales, and revenue by customer group. Visualize regional sales and monitor monthly order fulfillment and revenue trends. Perfect for sales managers aiming to drive growth and efficiency.

Pharma Sales Tracking by Representative
Track key operational metrics—including no-show rates, appointment wait times, provider utilization, and scheduling lead times—by integrating scheduling systems, EHR data, and front-office workflows. This connected approach enables healthcare teams to streamline appointment management, minimize delays, and enhance both provider productivity [...]
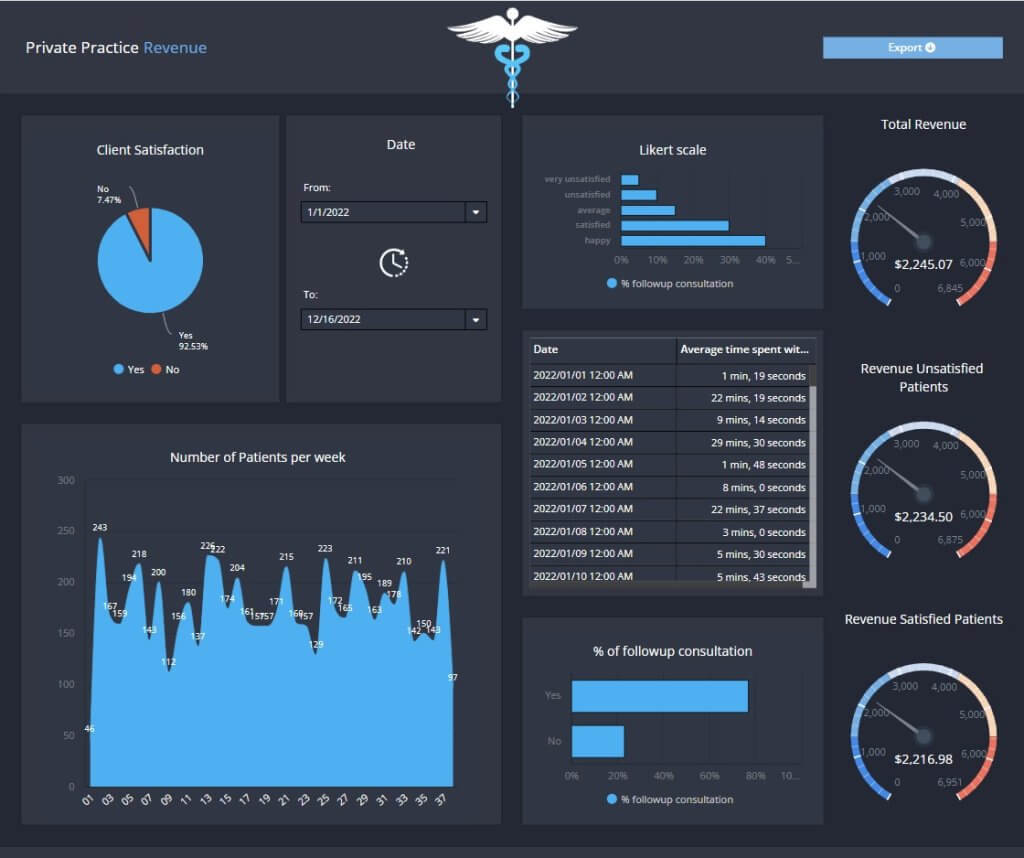
Private Clinic Performance
Monitor the performance of your private clinic or practice to optimize resource allocation and patient care quality. Track key performance indicators such as the number of patients your receive per week, their satisfaction, and your revenue.

Provider Analytics
Track key operational metrics including no-show rates, appointment wait times, provider utilization, and scheduling lead times by integrating scheduling systems, EHR data, and front-office workflows. With this integrated approach, you streamline appointment management, minimize delays, and enhance both provider productivity [...]