Whatever e-commerce tool you use for your business, it undoubtedly comes with some reporting capabilities. But while it may be a great foundation to set up your online shop, it likely falls short when it comes to providing the insightful, meaningful, and actionable data analysis you need to help you rise to the top of your market.
To get a truly commanding perspective on how your business is doing, you have to be able to combine your e-commerce data with your financial data, glean the combined analysis, and access those insights with vivid and practical dashboards. ClicData gives you that command.
There are just four steps to mastering your WooCommerce business intelligence with ClicData:
- Collect and connect your WooCommerce data and your financial data with ClicData.
- Merge and prepare your datasets within your own dedicated data warehouse.
- Tell your data story with stunning and practical dashboards.
- Share your insights, metrics, and reports with anyone, anywhere, for fast and efficient collaboration.
1. Centralize your business data in your own data warehouse
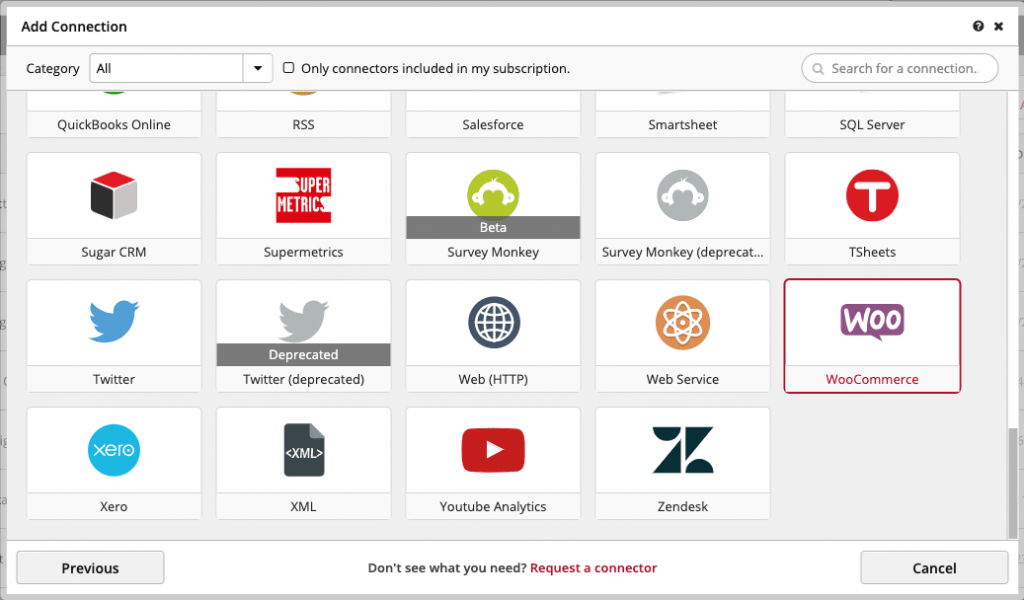
Use ClicData’s easy-to-use connectors or use APIs (web service connectors) to collect and connect any business data you want to analyze, such as financial and accounting, from a variety of platforms:
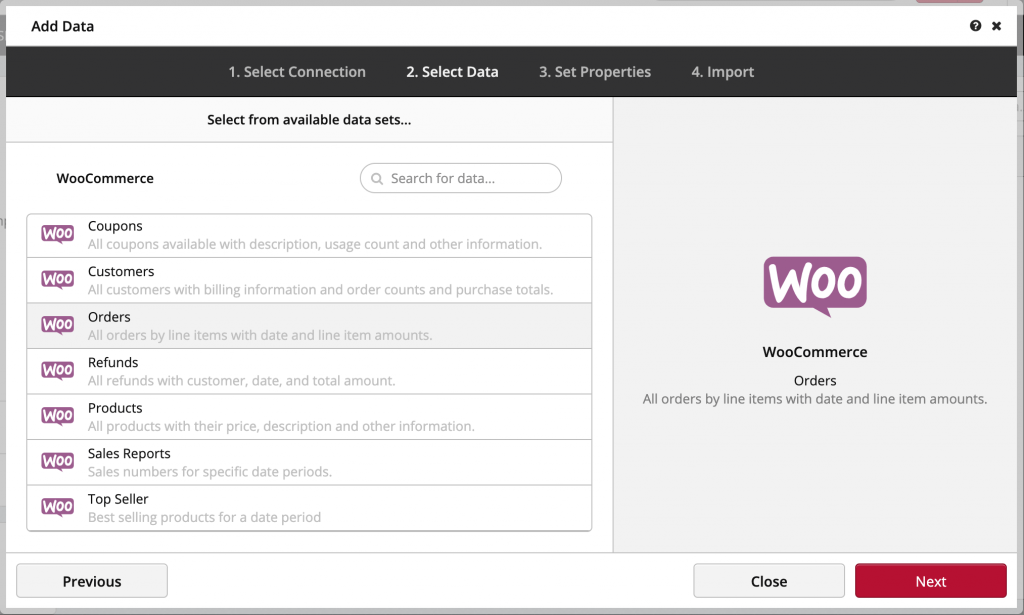
Choose the WooCommerce data you want to analyze—orders, visits, shipping, etc.
Schedule the frequency of your data refresh—weekly, daily, etc.
Connect them into your own dedicated cloud-based data warehouse.
2. Merge and prepare the datasets for use
With ClicData, you can cleanse, merge, transform and combine any type of data from any source automatically with our ETL features.
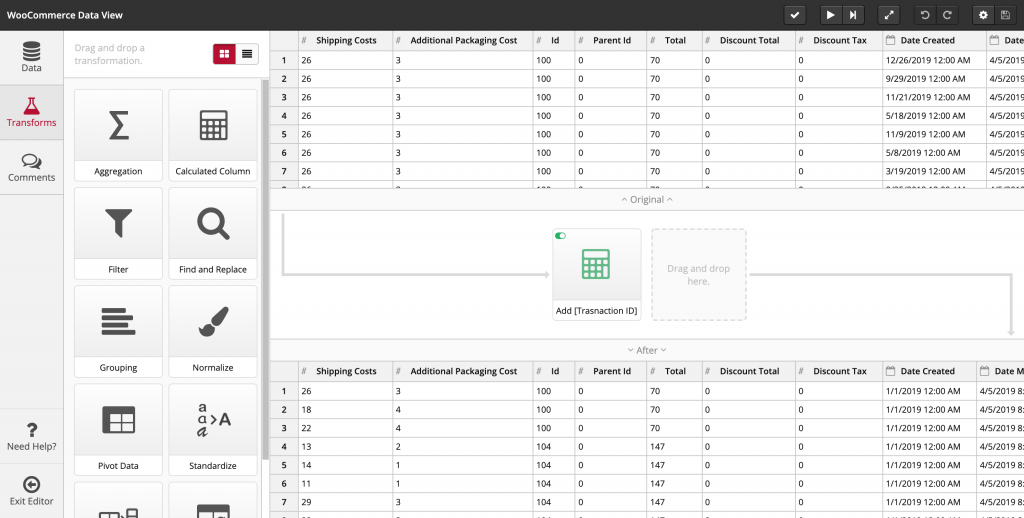
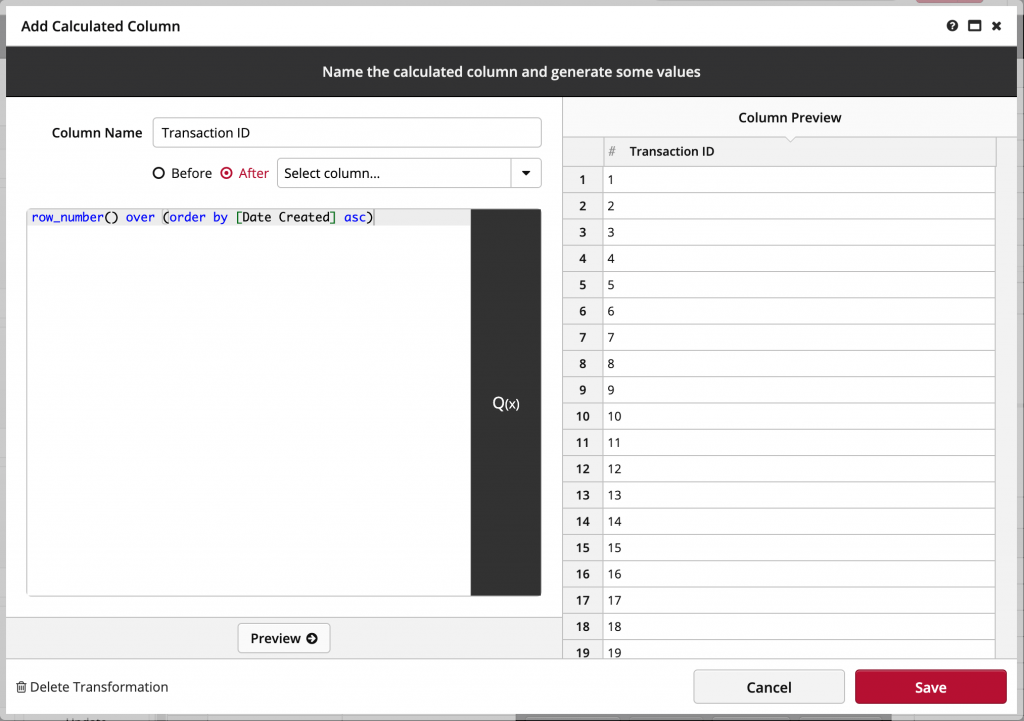
You can also create calculated columns for a deeper dive into your data. In this example, we add an index column to the existing dataset based on the date of the order.
3. Create your dashboards
Choose from an array of powerful widgets to deliver the data you seek. Create seamless reports, such as profit and loss statements, product-specific performance, product-based financials, the total cost of goods, and more. For example:
- Use numeric indicators for total revenues and profits
- Insert area charts to compare revenue and shipping costs against profit
- Filter your data by date or product
- Use bar charts to visualize the order status in a product summary for each individual product or a combination of products
- Feature a financial summary to provide high-level insights, such as Inventory Turnover, Profit vs. Revenue, and Average Period to Sell Inventory
- Provide a map to measure the performance of your products in each world region you sell in.
- Filter the data using a date range picker, a product list, or even a KPI list.
Click this link to open the dashboard
4. Share and collaborate efficiently on real-time data
- Use automatic alerts. Schedule automated alerts to pro-actively prompt use of your dashboards. Choose the time, frequency, and format of the alert easily. Collaborate with your team or your customers like never before.
- Manage multiple WooCommerce accounts. It’s so easy to duplicate the calculations and dashboards you’ve already set up for use with different accounts or customers.
Get step-by-step guidance on using ClicData with WooCommerce!
ClicData Platform, The Power Behind Simplicity
ClicData is a 100% cloud-based Data Analytics platform that makes it easy, fast, and intuitive to track and analyze your e-commerce performance. With ClicData, you can glean high-level insights as well as finely-tuned detail from all of your business data combined. And with intuitive visualization tools, you can vividly tell your data story, through any operating system, on any device, anywhere at any time.