Bad data is a costly and time-consuming problem for analysts. A McKinsey survey found that 82% of professionals spend at least one day per week fixing data quality issues. Instead of analyzing trends and making strategic decisions, they are stuck correcting errors, handling missing values, and resolving inconsistencies. The financial impact is just as concerning, with Gartner estimating that poor data quality costs businesses an average of $15 million annually.
These issues have industry-wide consequences. Airlines lose revenue when pricing errors lead to incorrect fares. Financial institutions misclassify borrowers due to flawed credit-scoring models, restricting access to financial opportunities. ESG investments suffer as inconsistent and incomplete data hinder accurate risk and opportunity assessments.
Improving data quality is a daily challenge for analysts. Data augmentation offers a practical solution by enhancing data completeness, reducing bias, and expanding datasets. This guide explores techniques to help analysts refine datasets and extract more reliable insights.
Understanding Data Augmentation in Data Analytics
Data augmentation expands and improves datasets by modifying existing data or generating new samples. Analysts use this technique to correct data imbalances, improve model performance, and enhance the quality of insights. It helps when datasets are too small, contain missing values, or lack the diversity needed for accurate predictions.
Augmented vs. Synthetic Data
Augmentation and synthetic data generation serve different purposes in data science and analytics.
- Augmented Data: Makes controlled changes to existing data to introduce variation. This could mean applying transformations like scaling or noise injection in machine learning. It could involve feature engineering in structured data, such as adding new calculated fields based on existing records.
- Synthetic Data: Creates completely new data points that replicate real-world patterns. This approach is useful when real data is scarce or sensitive. It allows models to be trained on a broader dataset without exposing private information.
Why Data Augmentation Matters
Augmentation improves model performance by increasing data variety. It helps reduce overfitting, refine predictions, and build more reliable models. Raw datasets often fall short when it comes to delivering deep, meaningful insights.
For instance, consider analyzing customer churn. Standard fields like tenure, contract type, and payment method provide a snapshot of customer behavior. However, they lack the depth needed to identify key trends. Without additional context, models trained on raw data may miss patterns that could improve predictions, leading to weaker business decisions.
Data augmentation helps fill these gaps by creating new features from existing information. Instead of relying on a single variable like tenure, analysts can generate Customer Lifetime Value (CLV) to estimate long-term revenue potential.
Data Augmentation in AI & Machine Learning
Data augmentation generates new data from the existing set to help create larger, more diverse datasets. It also helps machine learning models generalize better and avoid pitfalls like overfitting. While augmented data can introduce bias, it remains a valuable technique for creating reliable machine learning models.
Common techniques for data augmentation include:
- Synthetic Data Generation: Creating new, artificial data points to add variety.
- Resampling and Oversampling: Adjusting class imbalances so the model can learn from all categories equally.
- Data Transformation: Changing data through normalization, scaling, or adding noise to make models more robust.
How ClicData Powers Data Augmentation
Data augmentation is critical in refining datasets, ensuring they are comprehensive, accurate, and ready for AI and analytics. However, manual data augmentation can be both slow and prone to errors. Analysts often face challenges like integrating multiple data sources, transforming raw data, and keeping everything consistent across the dataset.
This is where ClicData steps in. The platform provides powerful automation tools that streamline and optimize the augmentation process. Analysts can easily automate transformations, enrich data, and maintain consistency with features like Data Flow and Data Templates. This automation means analysts spend less time on data preparation and more time on analysis, ultimately improving the overall efficiency of the workflow.
Data Flow: Automating Data Processing & Augmentation
Automating data augmentation allows you to apply transformations quickly and at scale. Here is how ClicData creates automated data pipelines for data augmentation:
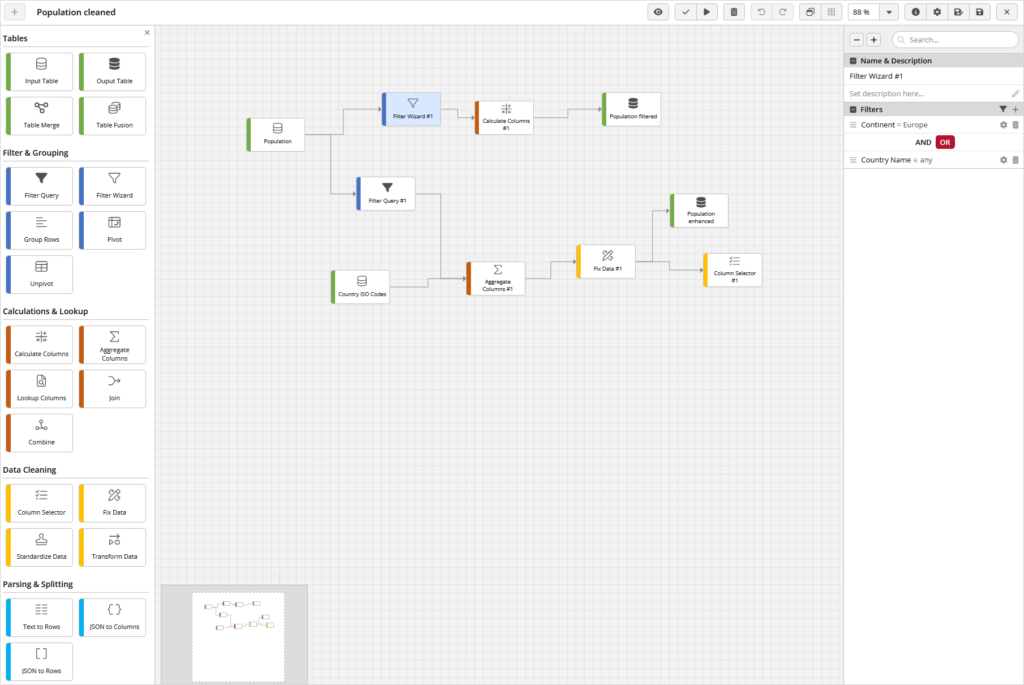
What is Data Flow?
ClicData’s Data Flow is designed to simplify the creation of structured and repeatable data augmentation workflows for analysts. It allows users to define processing steps, apply custom transformations, and maintain enriched, actionable data without manual input. Here’s how:
- Simulate and Validate: Test your transformations before applying them to ensure they work as expected and stay consistent.
- Automation: Schedule updates and automate workflows to save time and keep data fresh without constant manual input.
- Geocoding and AI Processing: Add advanced nodes for geocoding and AI processing to improve the value of your data, just like how data augmentation boosts machine learning models.
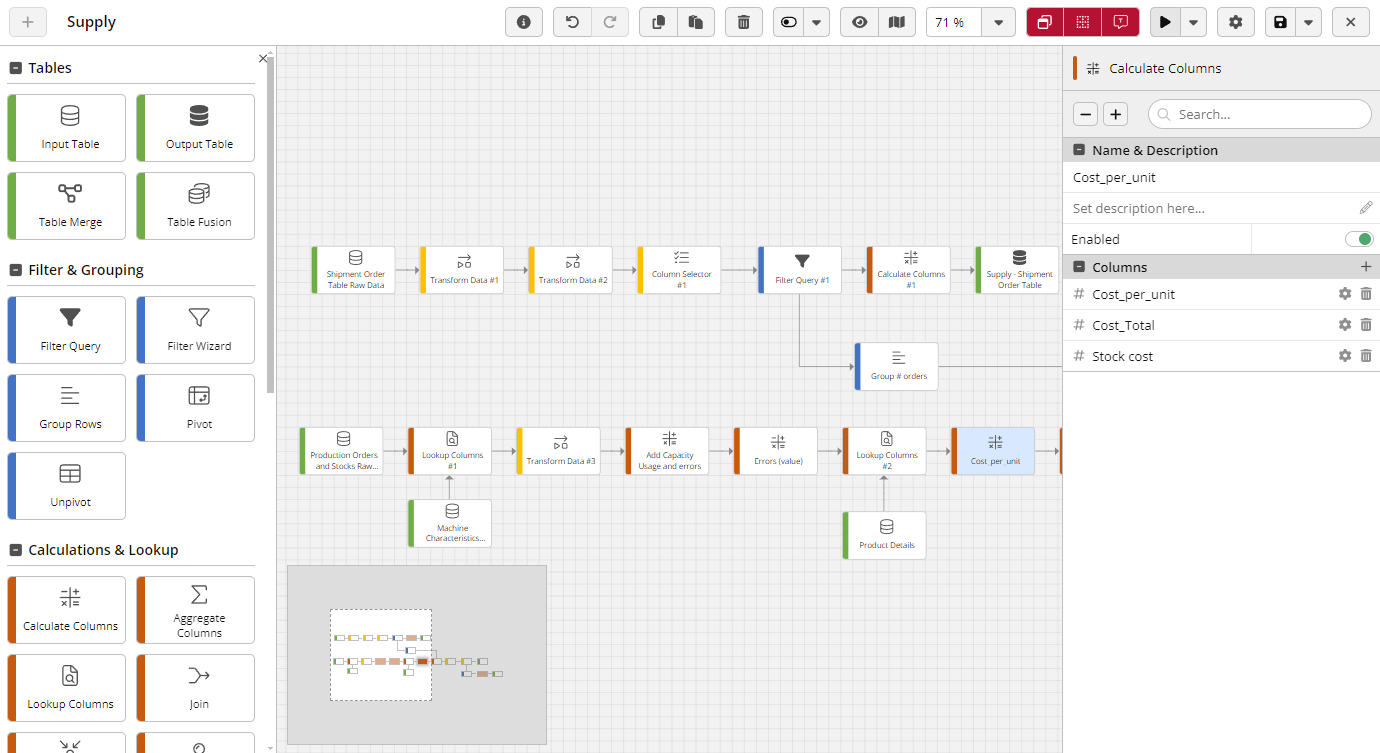
Key Features of Data Flow for Data Augmentation
- Automated Data Processing: Empowers analysts to modify, clean, and enrich datasets using a visual, step-by-step interface.
- Feature Engineering & Transformation: Supports the creation of new calculated fields, categories, and data aggregations.
- Intelligent Data Enrichment: Improves data context and accuracy by merging internal datasets with external sources.
- Scalable Workflows: Ensures consistent and standardized application of augmentation processes across datasets.
Data Templates: Standardizing and Scaling Data Augmentation
Data templates offer a structured approach to scaling and standardizing data augmentation, making it easier for analysts to enrich and transform datasets efficiently.
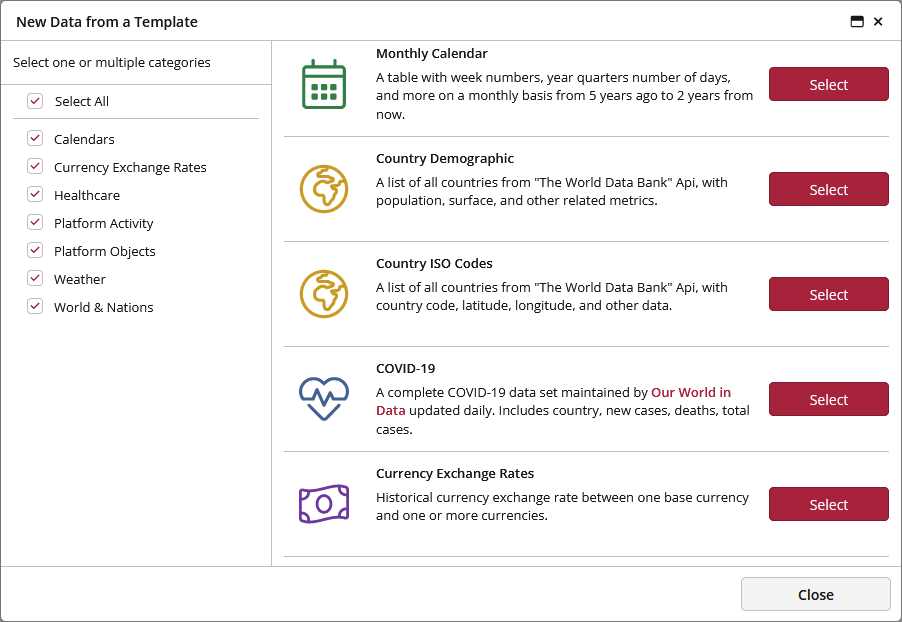
What are Data Templates?
ClicData’s Data Templates provide a straightforward, efficient way for analysts to apply data augmentation techniques. These templates act as predefined, customizable blueprints, allowing easy data enrichment and transformation. Rather than building workflows from the ground up, analysts can simply use these templates to handle common tasks, such as integrating external data, generating new features, and structuring datasets.
In addition to these standard workflows, ClicData offers a variety of universal templates, such as Calendars, Timetables, Country ISO codes, and more. These ready-made templates save time and help maintain consistency across different data augmentation tasks.
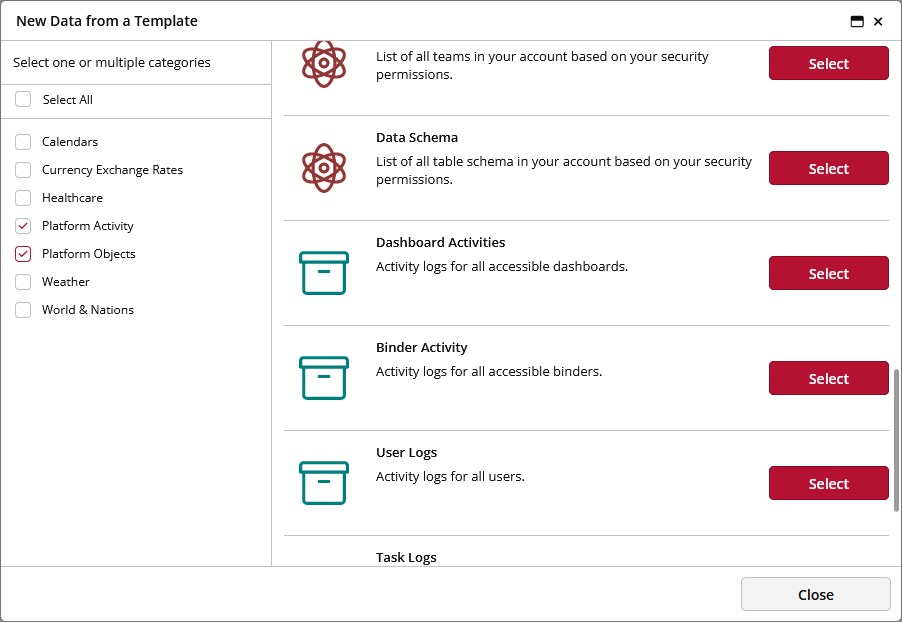
Right now, you can find templates for:
- Various Calendars: Weekly, monthly, hourly, and more.
- Country Data: Including ISO codes and key demographic indicators.
- Health Data: Such as COVID-19 statistics.
- Weather Data: Historical and forecast data for temperatures, sunset and sunrise times, snowfall, rain, etc.
- Currency Exchange Rates: Daily exchange rates from one currency to another or multiple currencies.
- Platform Activity: Logs for dashboard activities, binder activities, user logs, email activity, and task logs.
- Platform Objects: Metadata for all objects, including the data schema for datasets.
Key Features of Data Templates for Data Augmentation
- Predefined Augmentation Workflows: Quickly apply enrichment processes with ready-to-use templates that save time and improve efficiency.
- Customizable Transformation Rules: Tweak templates to meet specific business needs.
- Seamless Data Integration: Support various data integration tasks, like blending multiple datasets, retrieving data from external APIs, and updating information in real time.
- Consistency Across Datasets: Ensure the data augmentation processes follow consistent rules and best practices.
Example Use Case: Customer Dashboard with Data Flow and Data Templates
A customer dashboard helps businesses track sales trends and make better decisions. Before data can be useful, it needs to be cleaned, organized, and enriched. Data Flow and Data Templates simplify this process by automating data augmentation.
Here, we will demonstrate how adding historical weather records can give a coffee store a clearer view of how a change in temperature affects sales throughout the year.
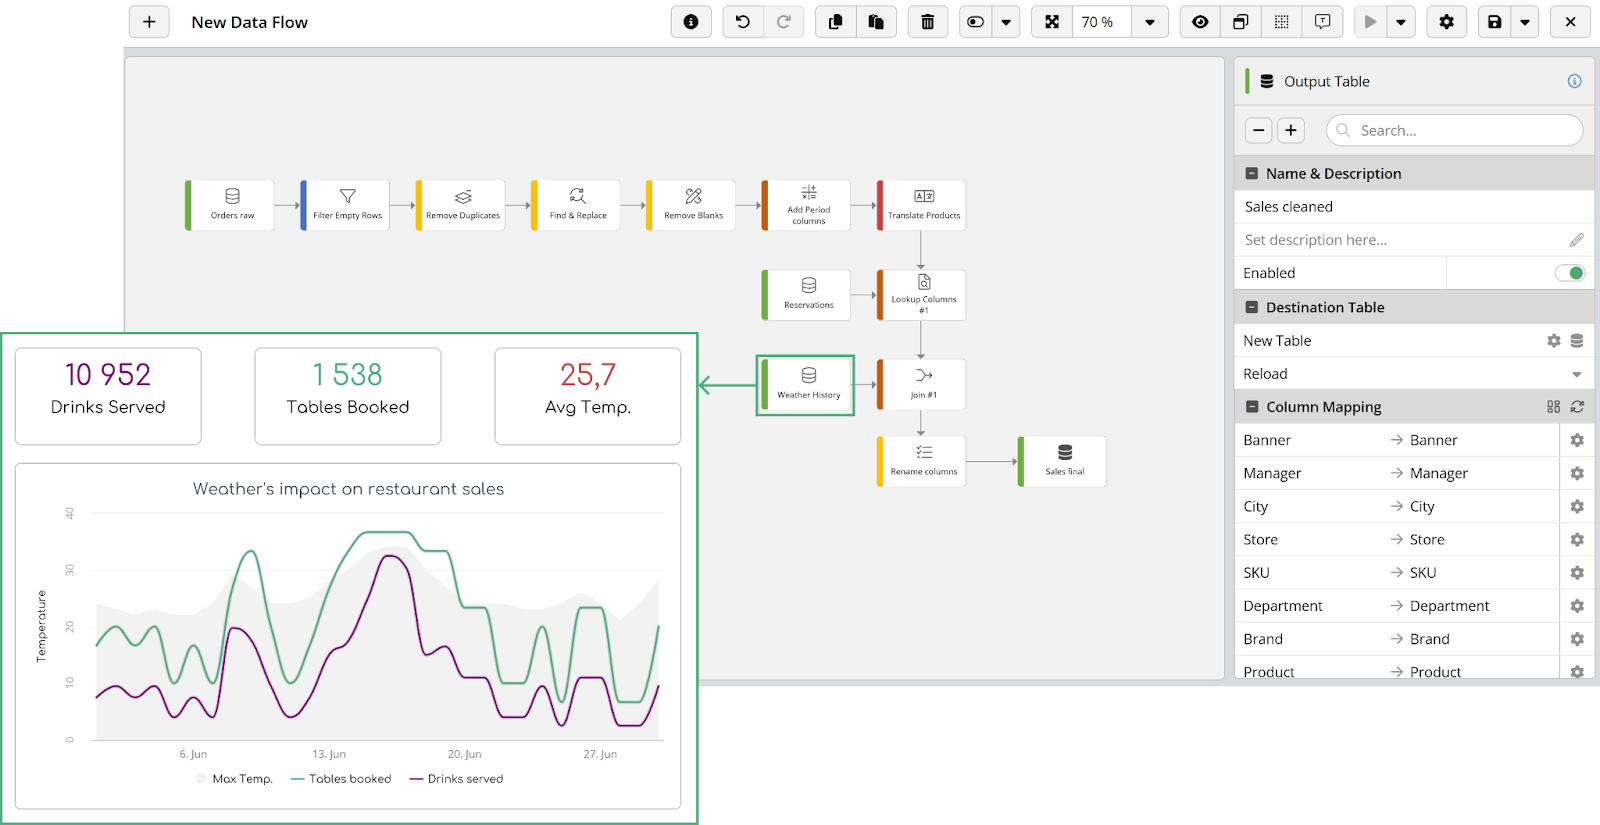
1. Data Flow Process: Transforming and Enriching Sales Data
Before augmenting new data, the business must ensure sales data is complete, accurate, and reliable.
Cleaning and Structuring Sales Data
Sales data often contains missing values, duplicate entries, and formatting issues. It needs to be cleaned before analysis.
- Removing incomplete records: Transactions missing critical information (such as date, time, or items sold) should be filtered out to prevent skewed insights.
- Standardizing formats: Ensure dates, product names, and pricing are consistent across all records.
- Eliminating duplicates: Due to system errors or manual entry issues, identical transactions may appear multiple times. Removing duplicate entries will ensure the business does not overestimate its sales.
- Fixing missing values: Empty fields are filled with standardized values to avoid inconsistencies. The following techniques can help impute data:
- Forward-filling (using the last available value)
- Replacing with the average/median of similar entries
- Assigning default or “unknown” values where necessary
Once the dataset is structured, it becomes easier to analyze.
Adding Context to Sales Data
After cleaning the data, the next step is to add details that help with analysis.
- Time Segmentation: Categorizing sales by day and month helps track performance trends.
- Feature Engineering: Creating new features such as average order value (AOV) reveals customer spending habits and opportunities to boost revenue.
- Product Categorization: Grouping menu items into categories allows for better comparisons.
Integrating Historical Weather Data
External factors like weather influence sales. The business can see how weather conditions impact customer purchases by adding historical weather data.
- Matching sales with weather conditions: Each transaction is paired with temperature, precipitation, and other weather details from that day.
- Identifying trends: Businesses can analyze sales patterns, such as increased cold coffee sales in hot weather or higher demand for hot coffee on days with colder temperatures.
Breaking Down Sales by Time of Day and Season
Weather affects sales differently depending on the time of day and season. Analyzing sales data with these factors in mind helps create more detailed insights.
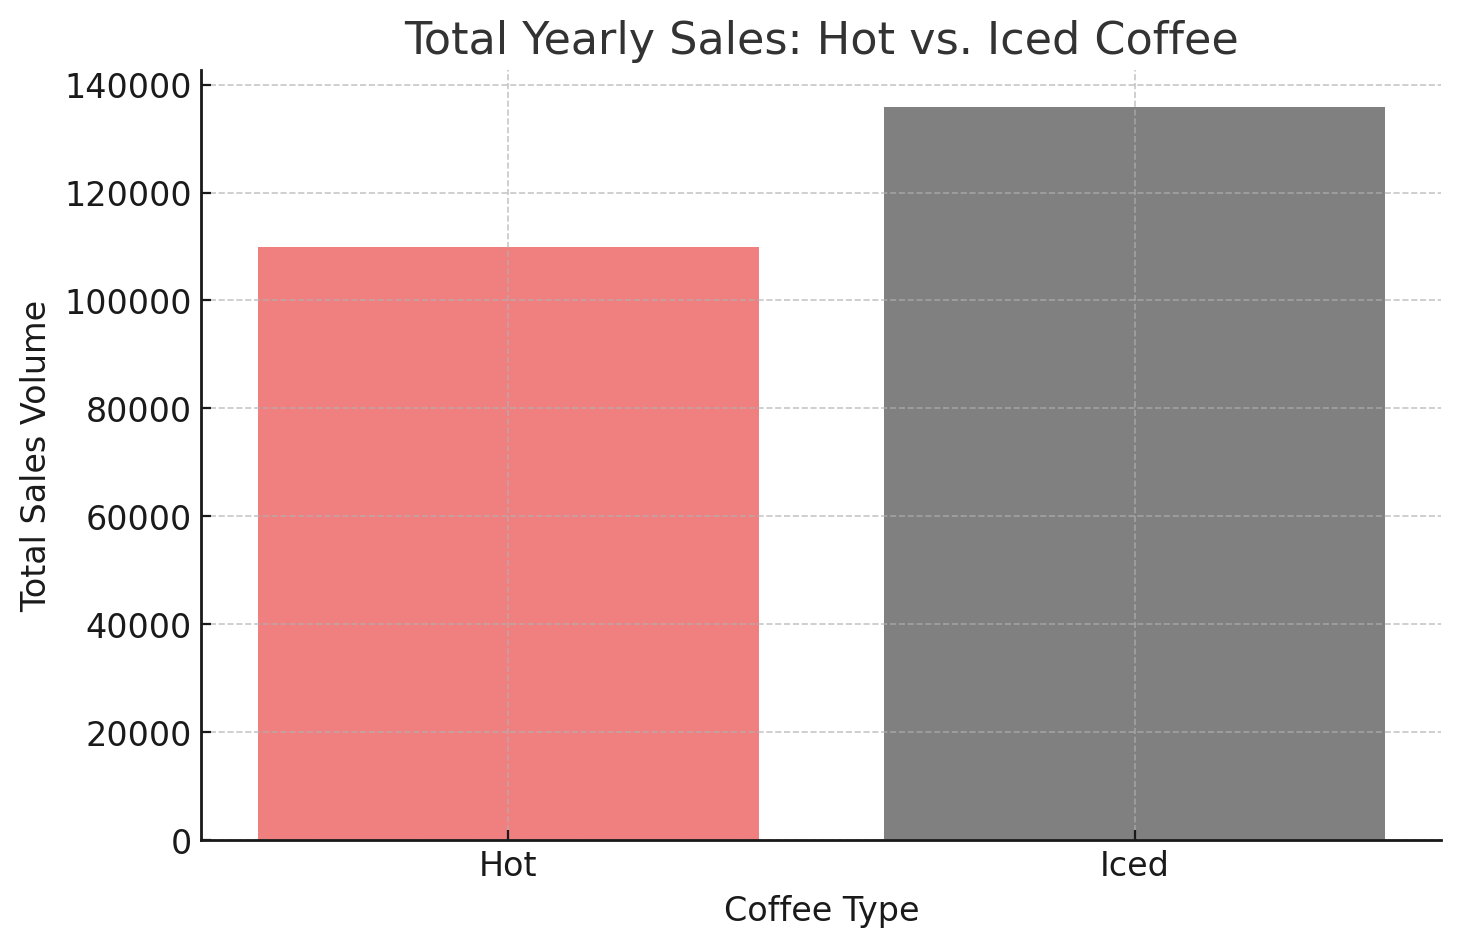
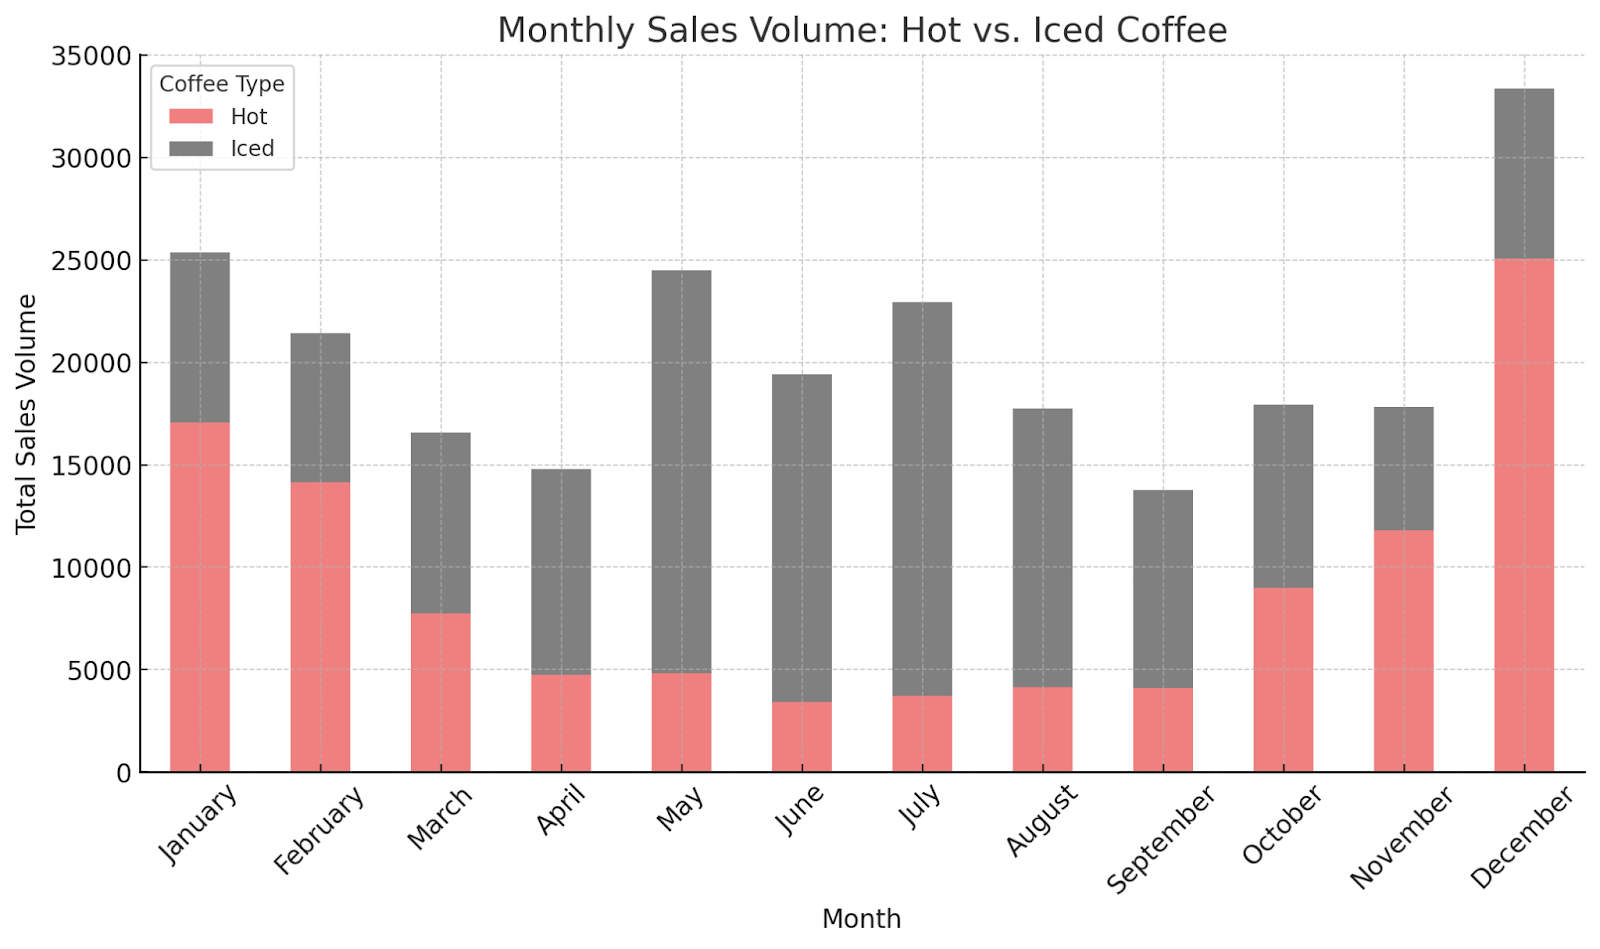
- Seasonal Trends: Comparing hot and iced coffee sales can reveal differences in customer preferences under different seasonal preferences.
- Time-Sensitive Promotions: Understanding peak hours and seasonal demand patterns allows businesses to optimize pricing, promotions, and inventory management for maximum profitability.
Merging Data and Preparing for Analysis
After all transformations are applied, the final dataset is structured for reporting. It ensures that businesses can efficiently analyze trends and make data-driven decisions.
- Optimizing for Business Intelligence (BI): The final dataset is ready for use in dashboards and reports.
- Identifying Patterns and Forecasting: With a well-structured dataset, businesses can use predictive analytics to anticipate customer demand, seasonal trends, and operational needs.
With all relevant data combined, the coffee store can analyze trends and adjust operations. Combining sales data with weather records gives the business a clearer picture of what drives customer behavior.
- Understanding Demand Shifts: Identifying which products sell more under specific weather conditions helps with planning.
- Smarter Decision-Making: With detailed data, businesses can forecast demand, adjust inventory, and refine marketing strategies.
2. How the Weather Data Template is Used
Manually matching sales records with weather data takes time and can lead to inconsistencies. Data Templates automate this process, making it faster to integrate and analyze weather-based trends.
Automating Weather Data Integration
The Weather Data Template pulls in historical weather details, such as temperature and precipitation, and aligns them with sales transactions.
- Automated data retrieval: The template fetches weather data for each store and transaction date without manual input.
- Consistent structure: Data is formatted the same way across all records, avoiding errors.
- Scalability: The same template can be applied across multiple locations, reducing setup time.
Aligning Weather Data with Sales Records
Weather conditions must match the correct store, product sales, and time segments. The Weather Data Template includes predefined mappings to simplify this process.
- Combining sales and weather data: Sales records are linked with weather details to provide complete insights.
- Product-level tracking: Connects weather conditions with specific products to identify trends.
- Time-based segmentation: Groups data by day, week, month, or season to spot long-term patterns.
Prebuilt Calculations for Faster Insights
It takes extra effort to manually create formulas to track weather-related sales patterns. The Weather Data Template, however, comes with built-in calculation fields to speed up the process.
- Temperature impact tracking: Compares daily temperatures to seasonal averages and their effect on demand.
- Product sales by weather condition: Identifies which items sell more in specific weather conditions, like hot drinks in winter or ice cream in summer.
- Seasonal sales analysis: Highlights product performance trends across different seasons.
Keeping Data Consistent Across Dashboards
Standardized processing helps maintain accurate reporting across multiple business locations. Using Data Templates keeps all weather-based insights structured the same way.
- Uniform processing: Prevents discrepancies from inconsistent methods.
- Reusable templates: Works across new locations, datasets, or periods without extra setup.
- BI-ready formatting: The dataset is structured for dashboards, reducing manual adjustments.
Faster Dashboard Setup with Fewer Manual Steps
Integrating weather data into dashboards does not require custom scripts or manual work. Data Templates make the process easier.
- Track seasonal trends to refine promotions.
- Predict demand shifts based on temperature and precipitation
- Adjust regional strategies using weather-based insights.
- Automate analysis without additional development work.
The Weather Data Template speeds up data integration, allowing businesses to focus on decisions rather than manual data preparation.
3. Insights and Business Impact: How Weather Affects Coffee Sales
After cleaning, transforming, and enriching sales data using Data Flow and integrating weather-related insights with Data Templates, the final step is analyzing and visualizing the results.
A fully automated customer dashboard allows the coffee store to make informed staffing, marketing, and inventory decisions.
A structured, real-time view of a weather-driven sales customer dashboard helps the business plan ahead rather than reacting to external conditions at the last minute.
Uncovering Weather-Driven Sales Trends
Data Flow and Data Templates make it easy to analyze sales data alongside weather conditions. This helps the business adjust forecasting, improve operational planning, and optimize resources based on past and real-time trends.
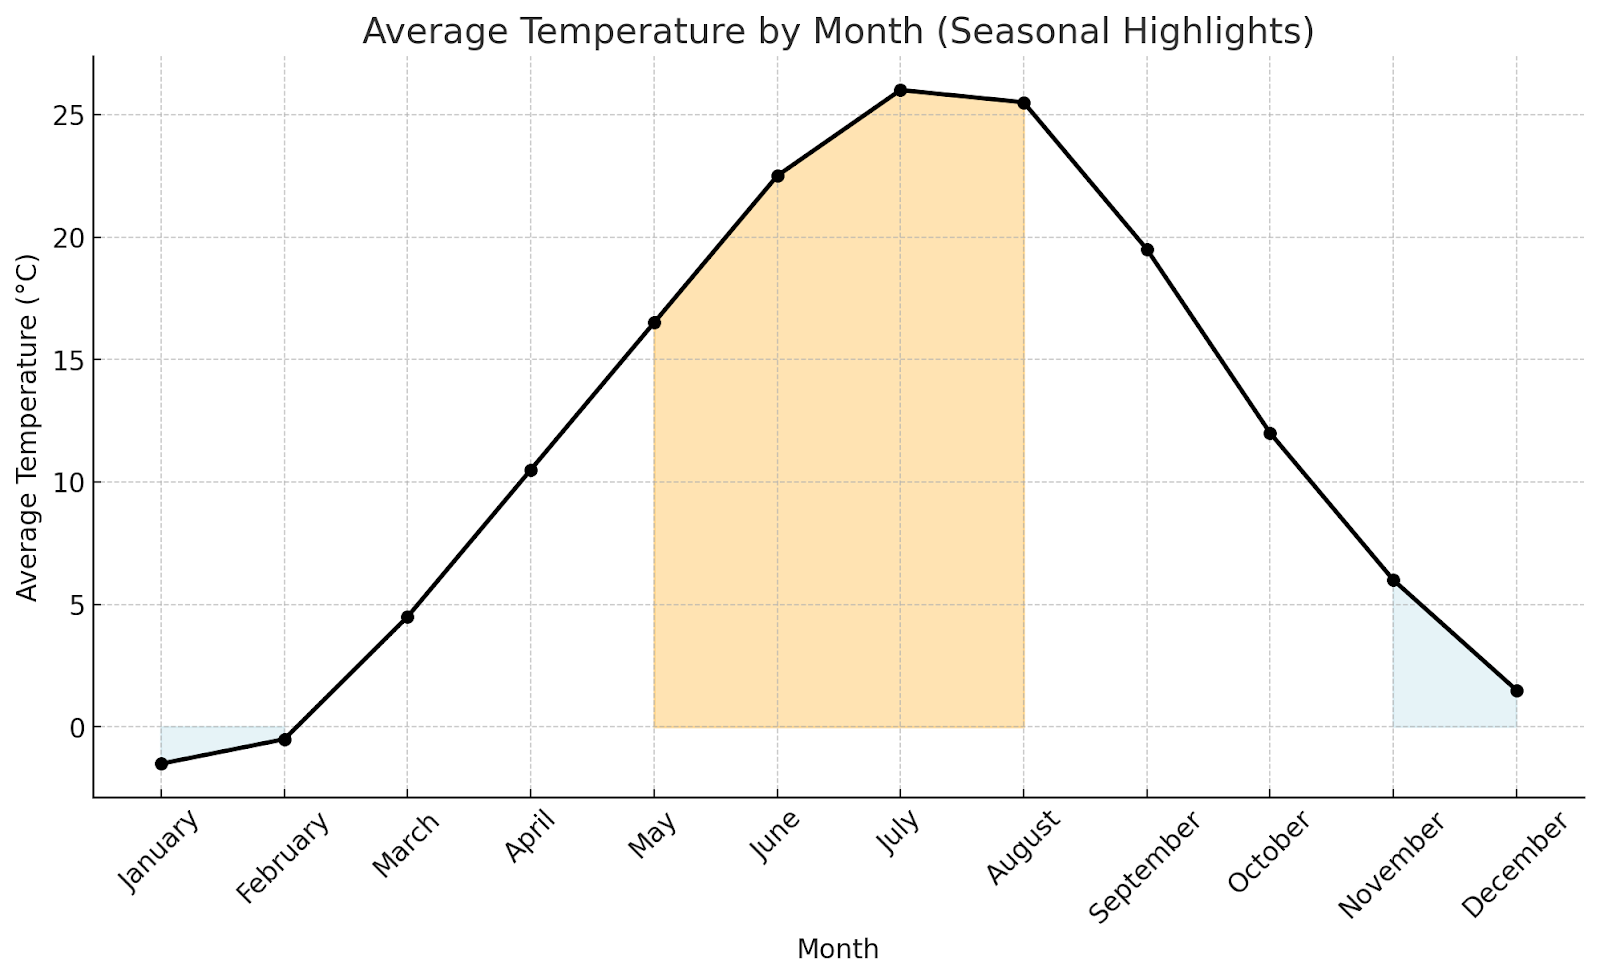
- Correlation Between Temperature & Coffee Sales
- Hot Coffee Sales (-0.82 Correlation): A strong negative relationship. Hot coffee sales decline significantly as temperatures increase.
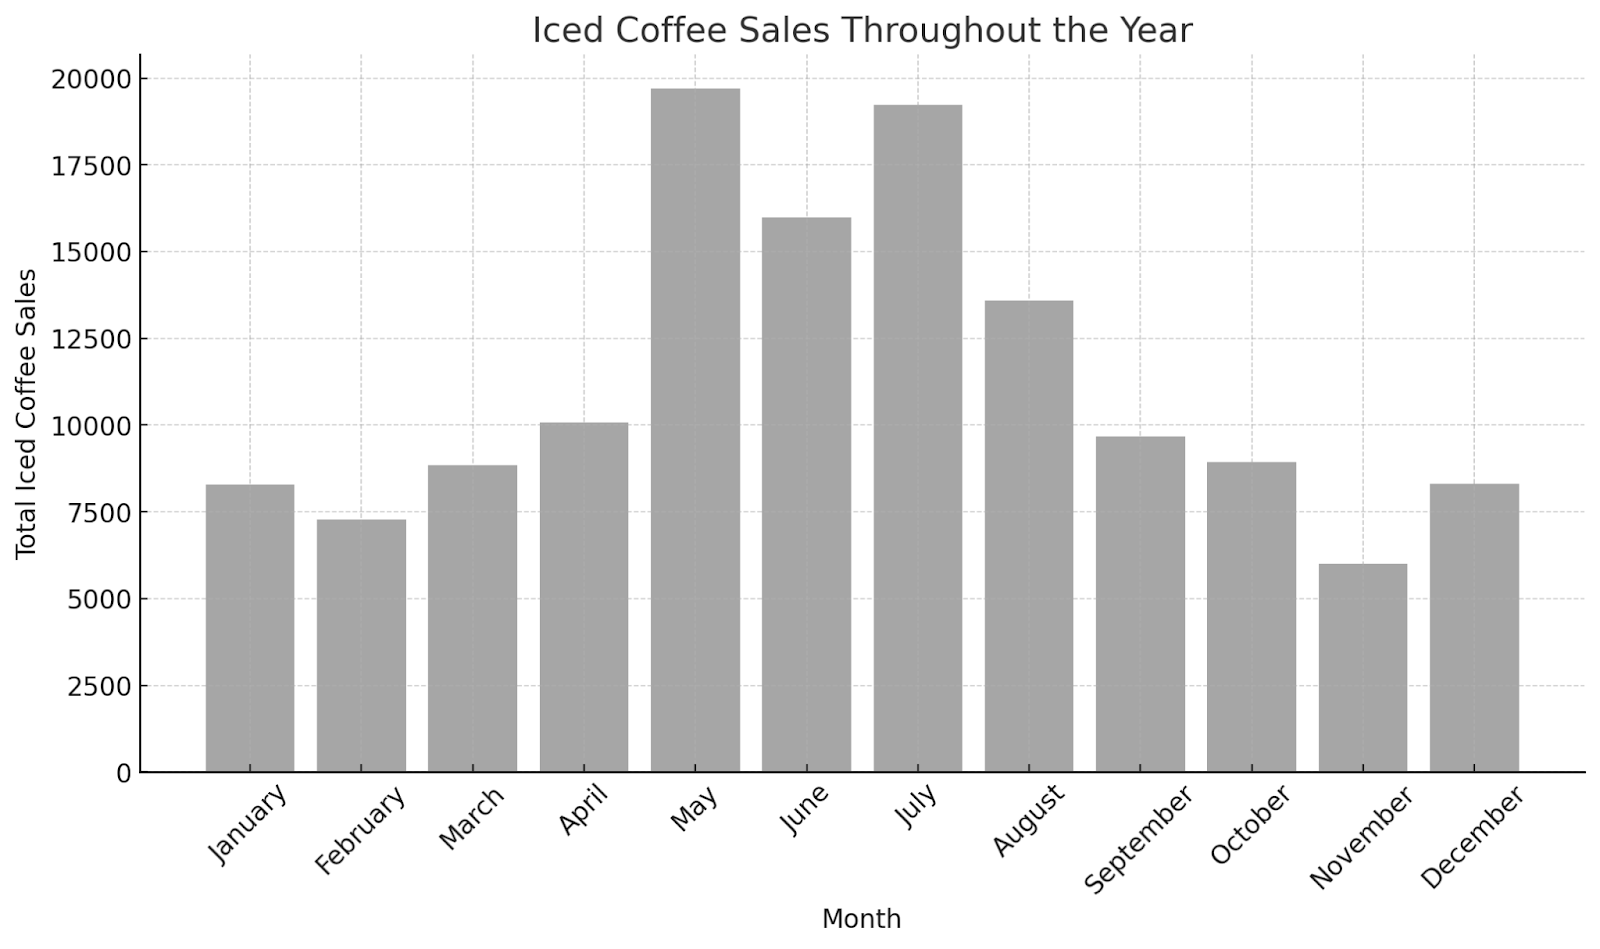
- Iced Coffee Sales (+0.76 Correlation): A strong positive relationship. As temperatures increase, iced coffee sales rise consistently.
This insight allows the business to predict seasonal demand patterns and allocate resources more efficiently.
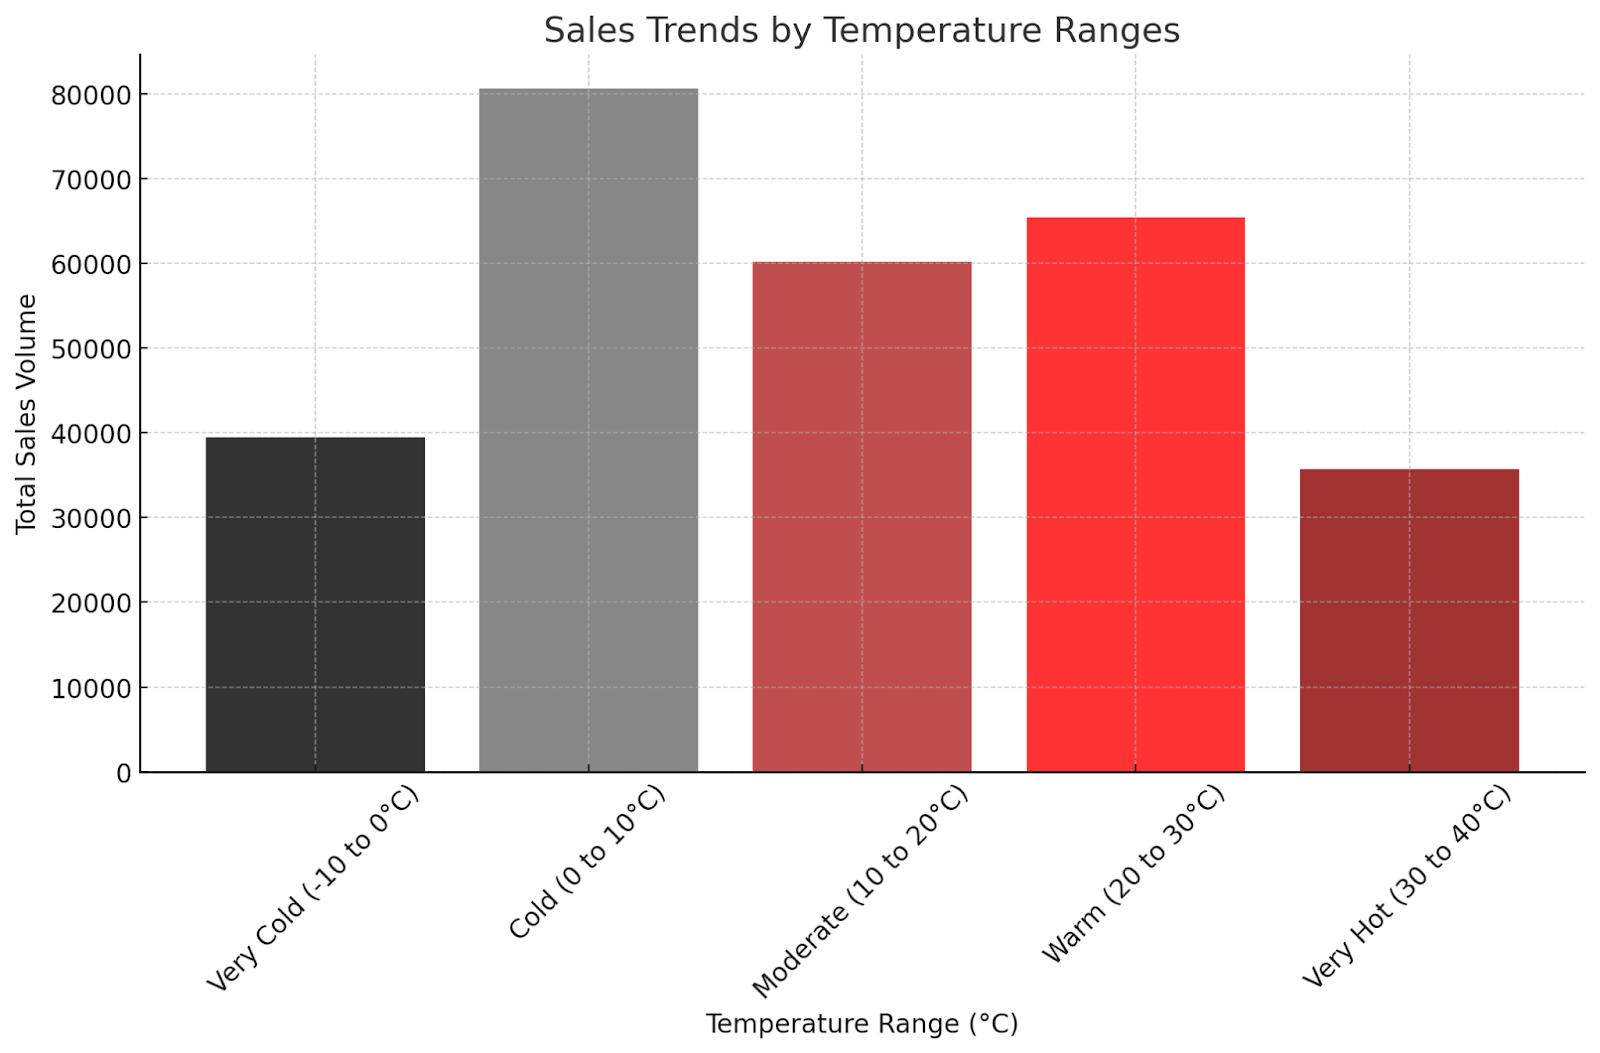
- Sales Trends by Temperature Ranges
Analyzing how coffee sales fluctuate across temperature ranges can help the business pinpoint optimal sales periods and develop seasonal strategies.
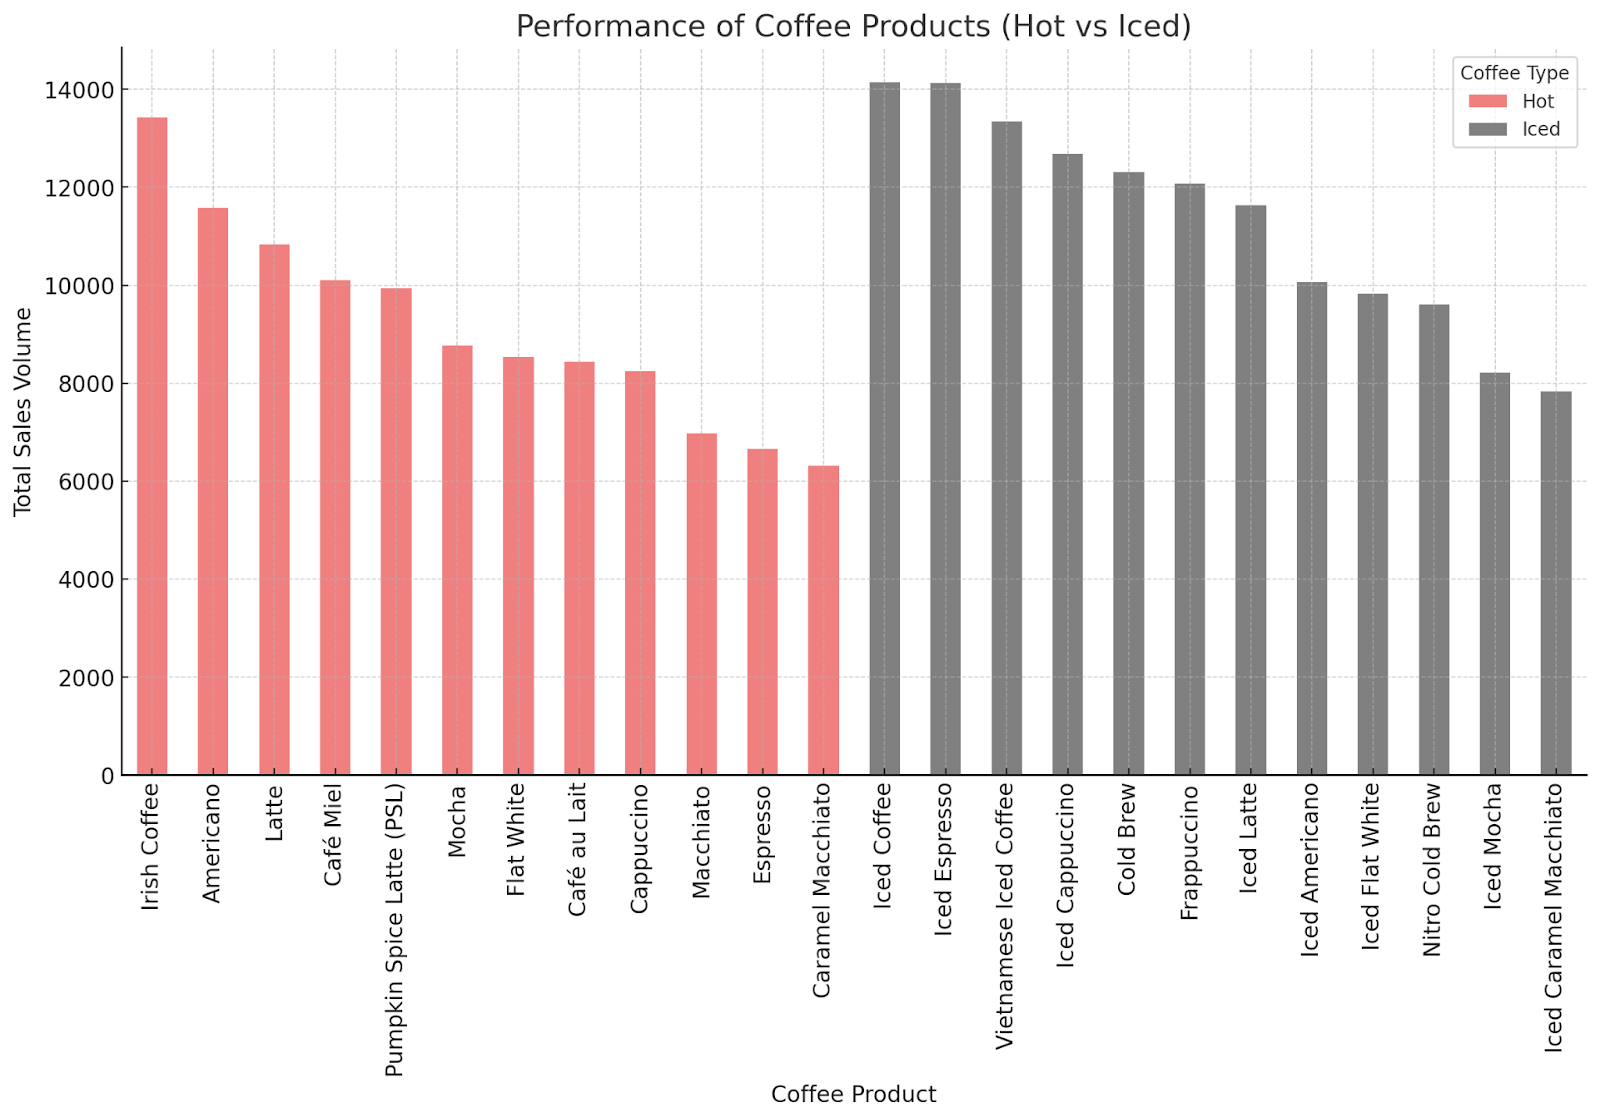
- Very Cold (-10 to 0°C): Peak hot coffee demand. High sales of espresso, cappuccino, and Irish coffee are increasing as customers seek warm beverages.
- Cold (0 to 10°C): Highest total coffee sales volume across all temperature ranges. Strong demand for traditional hot coffee beverages like Café au Lait and Caramel Macchiato.
- Moderate (10 to 20°C): Hot coffee demand declines while iced coffee consumption rises. Popular choices include Americano, Cold Brew, and Iced Latte.
- Warm (20 to 30°C): Sales stabilize as hot coffee declines, but iced coffee compensates. Popular beverages include Iced Mocha, Nitro Cold Brew, and Iced Espresso.
- Very Hot (30 to 40°C): This region has the lowest total sales volume but the peak iced coffee demand (Frappuccino, Vietnamese Iced Coffee).
Visualizing Weather’s Impact on the Dashboard
A real-time customer dashboard powered by Data Flow and Data Templates transforms how a business understands sales trends, forecasts demand, and makes operational decisions. Instead of reacting to trends after they happen, the business can predict and adapt in real-time.
Visualizing the impact of weather through scatter plots, heatmaps, and trend analysis can help the business better understand forecasting models.
A Smarter, More Predictive Customer Dashboard
A customer dashboard powered by Data Flow and Data Templates gives the coffee store real-time insights into how weather impacts sales. Instead of guessing when to adjust inventory, marketing, or staffing, the business can track these trends and make data-backed decisions.
Weather plays a huge role in customer behavior. A drop in temperature can lead to higher sales of hot coffee, while a heatwave might boost demand for iced drinks. A well-structured dashboard can help the business plan for these shifts before they happen.
Here’s what the business can do with weather-driven insights:
- Adjust demand forecasts based on temperature changes.
- Stock seasonal products in advance.
- Launch promotions that match upcoming weather conditions.
A system that updates automatically makes planning easier and more accurate.
4. Data-Driven Business Insights
Instead of relying on manual tracking or outdated reports, the coffee store can gain real-time insights that help them:
- Adapt to seasonal trends.
- Improve inventory planning.
- Optimize marketing campaigns.
- Manage staffing efficiently.
A predictive approach helps businesses run more smoothly, reduce costs, and improve customer satisfaction. Here’s what the dashboard can communicate:
- Cold weather increases hot coffee sales.
- Warm weather boosts demand for iced drinks.
- Sales shift noticeably around 20°C, signaling when to adjust stock and promotions.
Tracking these patterns helps businesses stay ahead instead of reacting at the last minute.
How to Plan Inventory Based on Weather
- Hot Coffee Season (Fall & Winter)
- Increase orders for coffee beans and seasonal flavors.
- Stock up on milk, syrups, and spices for holiday drinks.
- Iced Coffee Season (Spring & Summer)
- Keep cold brew ingredients in stock, including ice and flavored syrups.
- Make sure takeaway cups are available for higher iced coffee demand.
Having the right stock at the right time keeps sales steady and reduces waste.
Marketing That Matches the Season
- Winter Promotions
- Feature seasonal hot drinks like Pumpkin Spice Lattes.
- Offer special pricing on warm beverages during cold mornings.
- Summer Promotions
- Discount iced drinks on extra hot days.
- Introduce limited-time flavors like Nitro Cold Brew.
Seasonal marketing helps businesses maximize revenue while keeping customers engaged.
Staffing Adjustments for Peak Demand
- Mornings in Cold Weather : Expect higher demand for hot drinks, so schedule more staff during early hours.
- Afternoons in Hot Weather : More iced drinks mean more orders later in the day, so shift staffing accordingly.
How Pricing Can Increase Sales
- Colder Months : Promote premium hot drinks as an upsell option.
- Warmer Months : Bundle iced coffee with snacks to encourage add-on purchases.
The Challenges of Scaling Data Augmentation
A structured augmentation process improves accuracy, enhances AI models, scales efficiently, and keeps insights up to date. However, scaling data augmentation comes with challenges, especially when working with multiple sources.
Businesses rely on internal databases, cloud platforms, APIs, and unstructured data sources like social media and system logs. Each presents challenges that make augmentation harder to scale.
Extracting Data from Multiple Sources Takes Time
Pulling data from different systems is complex.
- Data formats vary, making integration harder.
- Update frequencies differ, causing inconsistencies.
- API restrictions and authentication barriers slow down extraction.
- Large datasets require automation to prevent delays.
Cleaning and Transforming Data is Resource-Intensive
Raw data is rarely ready for analysis.
- Missing values need to be addressed.
- Duplicate records inflate insights and distort reports.
- Naming conventions, time zones, and currency units must be standardized.
Real-Time Processing is Difficult to Maintain
Keeping data updated in real time requires efficient workflows.
- Large data volumes slow down processing.
- Dependencies between datasets delay updates.
- Manual integration increases errors and inefficiencies.
Scaling Becomes Harder as Data Grows
Expanding datasets introduce new challenges.
- Storage and processing limitations impact speed.
- More data sources mean more complexity.
- Larger datasets slow down queries and transformations.
Security and Compliance Need to Be Managed
Handling multi-source data comes with security and regulatory risks.
- Privacy laws require proper data handling.
- Access controls limit sensitive data to authorized users.
- Audit trails track changes for accountability.
A Smarter Way to Scale Data Augmentation: ClicData
Businesses working with multiple data sources need a system that automates extraction, standardizes data, scales efficiently, and meets security requirements. Without it, augmentation slows down and increases compliance risks.
ClicData’s Data Flow and Data Templates solve these challenges with:
- A visual, drag-and-drop interface for seamless integration.
- Automated data cleaning, enrichment, and transformation across sources.
- Real-time updates and scalable processing to handle growing datasets.
- Security and compliance tools to protect sensitive information.
How ClicData Simplifies End-to-End Data Augmentation
ClicData provides a structured approach that automates data extraction, transformation, and enrichment, making it easier to work with multiple sources.
Faster and More Efficient Data Processing
ClicData reduces this workload by automating enrichment tasks and applying predefined augmentation rules to maintain consistency across datasets. Analysts no longer need to spend hours fixing formatting issues or merging records; they can instead focus on generating insights.
The platform includes pre-configured Data Templates for integrating external datasets like currency exchange rates, weather patterns, and demographic statistics. Businesses can apply this information instantly instead of manually pulling and aligning it.
With a drag-and-drop interface, users can create sequential and parallel Data Flows to manage complex transformations without coding. This makes it easier to process data efficiently, even when working with multiple sources.
Higher Data Quality for More Reliable Insights
Accurate insights depend on clean, structured data. ClicData helps fill in missing values, detect inconsistencies, and apply rule-based transformations to ensure complete and accurate datasets.
The platform also supports external data enrichment, adding information like financial indicators, weather trends, and customer demographics to improve analysis. With automated outlier detection, businesses can eliminate data anomalies that might skew results.
Tracking customer journeys across multiple touchpoints is another advantage. By consolidating web activity, in-store interactions, and customer service logs, businesses gain a complete view of user behavior, leading to more informed decision-making.
Built for Large and Multi-Source Datasets
Processing large datasets from multiple sources can slow down traditional systems. ClicData is optimized for enterprise-scale data augmentation, ensuring smooth performance even when handling millions of records.
Real-time integration with APIs, databases, and cloud platforms keeps data updated automatically. The system also manages increasing data volumes without requiring manual intervention. Its optimized infrastructure allows fast lookups and efficient aggregation, reducing processing time.
Modular Data Templates allow businesses to bring in external industry data, historical records, or financial indicators without extensive setup. This flexibility makes it easier to scale data augmentation efforts as needed.
Seamless Integration Across Data Sources
ClicData supports structured and unstructured data, allowing businesses to connect databases, spreadsheets, APIs, and web sources into a unified system. Instead of working with siloed information, organizations can create a centralized, real-time data environment.
Python scripting is built into the platform, making it easy to apply advanced transformations and incorporate machine learning models. Businesses can also leverage open-source datasets, such as weather patterns or population trends, to enhance their analytics.
With modular Data Flows, users can design step-by-step processes for cleaning, transforming, and enriching data. This structured approach prevents errors and ensures data remains accurate and actionable.
ClicData facilitates end-to-end data augmentation by automating workflows, improving data quality, and providing seamless integration with external sources. Thus, instead of spending time on manual tasks, businesses can focus on analysis and strategy.
Conclusion: The Future of Data Augmentation with ClicData
A structured approach to data augmentation allows teams to work more efficiently and extract meaningful insights faster. Traditional tools often require custom coding and IT support, making scaling data augmentation difficult.
ClicData simplifies this process with an automated and user-friendly platform that handles large volumes of data from multiple sources. It provides a complete solution for data augmentation, helping businesses clean, enrich, and integrate data while saving time and improving accuracy.
Want to transform your data workflow? Start automating augmentation with ClicData’s free trial today.