We want to help you go deeper into analyzing the data through Pivot Tables by introducing those new features.
Conditional Formatting
Let’s assume we have a pivot table showing the Advertising Costs for some car models by year:
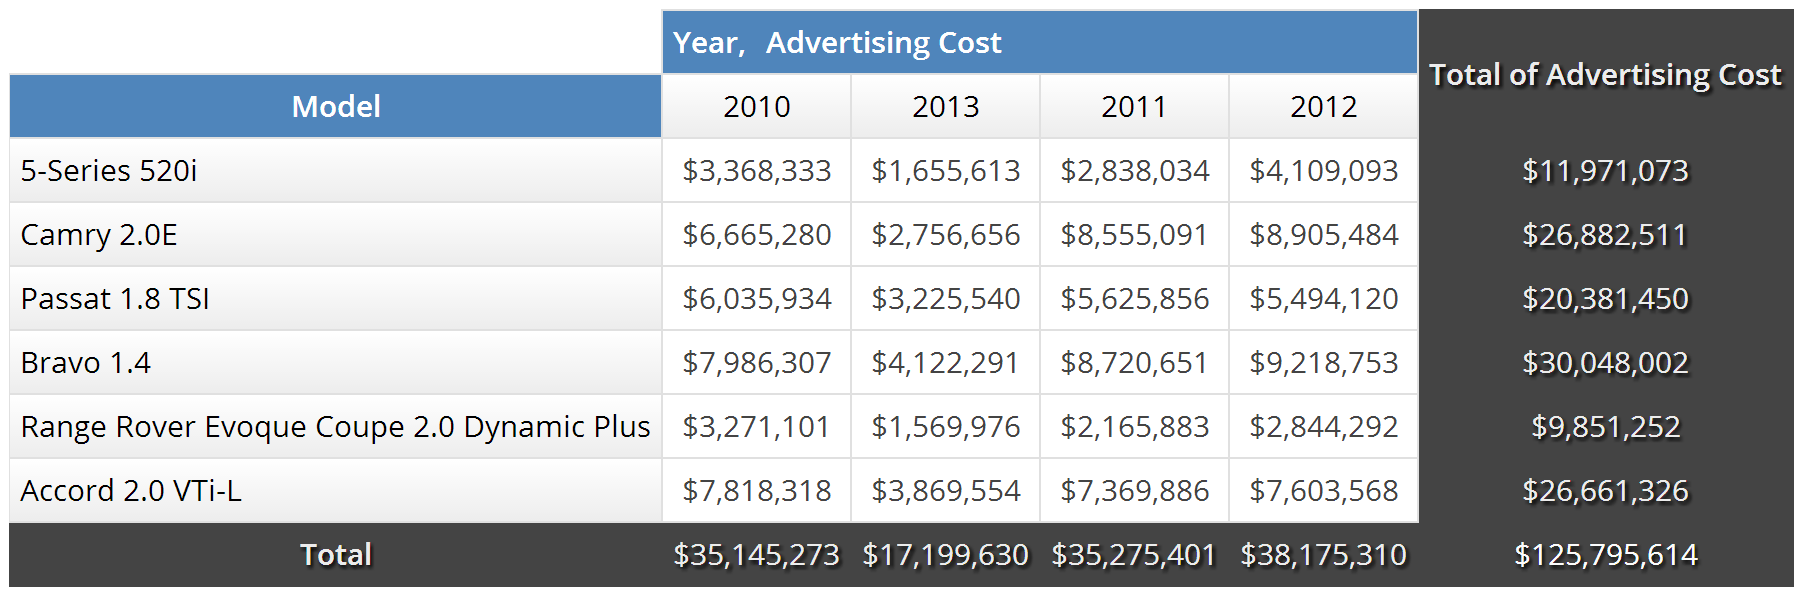
A good table design should allow the user to understand the data by just having a quick look at the table.
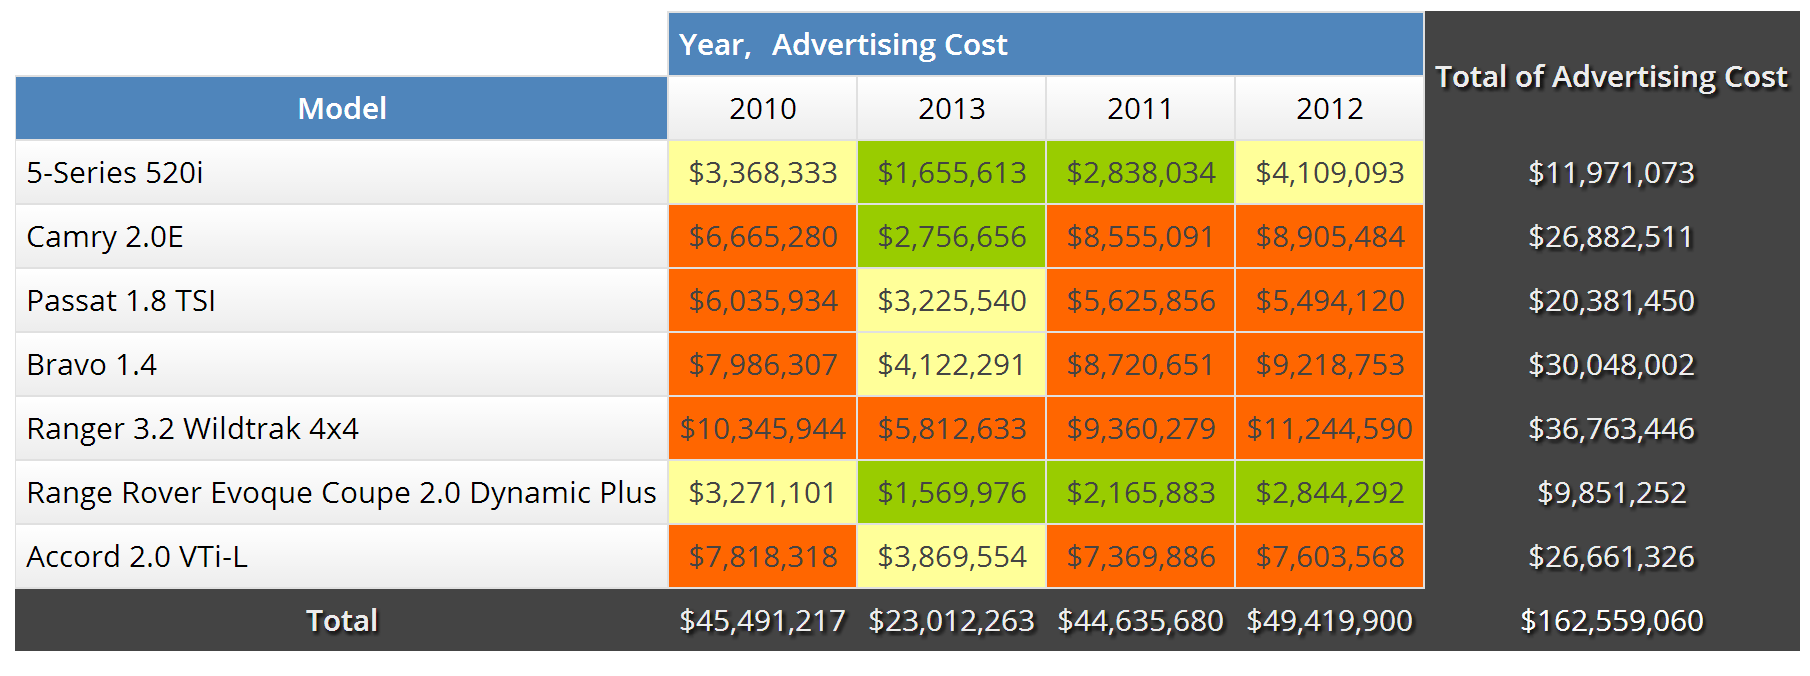
By accessing the table Properties– Conditional Formatting option, we can highlight the numbers that are within some ranges defined by the user and set up some formatting options (Font, Color, Size). Therefore, we will understand which Car Models the company spent more money on Advertising throughout the years. So, what do you think about the new table?
Calculated Column
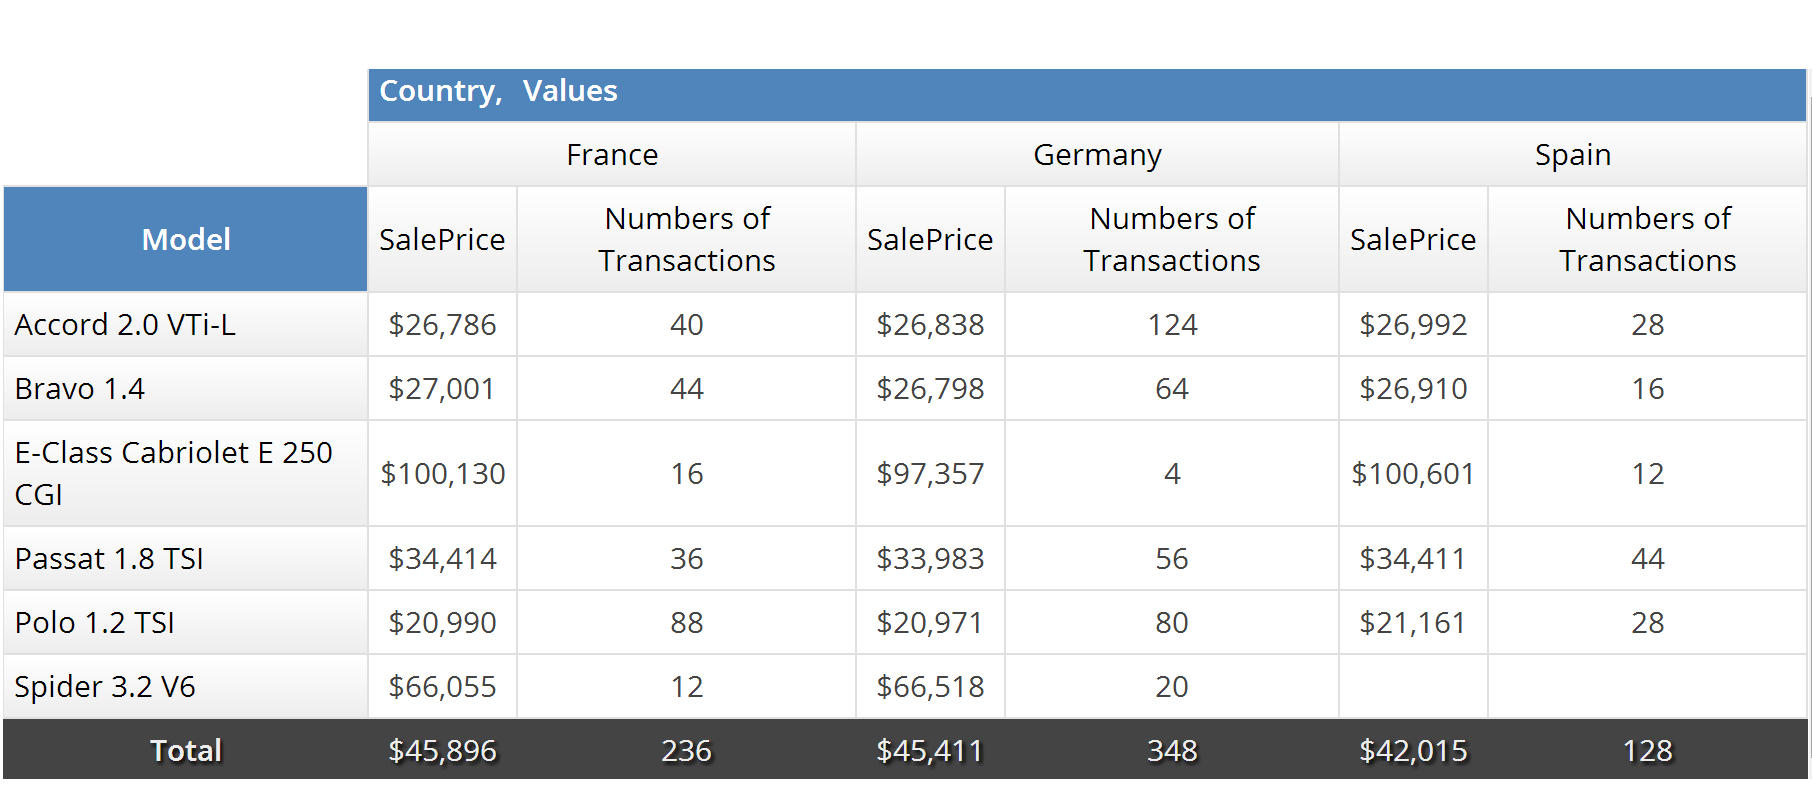
Furthermore, by accessing the table Properties – Values – Add a calculated column feature you can quickly create another indicator for your Pivot Table. No need to go back to the Data Transformation Section!
For example, we want to see how many transactions were done for a car model, by country, for a specific price. We just have to count the different TransactionId using the formulas editor (value(‘TransactionId’, ‘dcount’) ), name the new column and add it in the Values Section of the Pivot Table.
Hope this is useful! Click on the images to access the Dashboard!