If you never heard of the Hofstede’s theory, here is a little catch up for you. It is the first quantitative method to analyze a culture depending on a couple of dimensions: Individualism, Power Distance, Masculinity, and Uncertainty Avoidance.
Because we all know theory can be a little boring, I have put a short definition for each dimension in a ClicData dashboard I’ve built today.
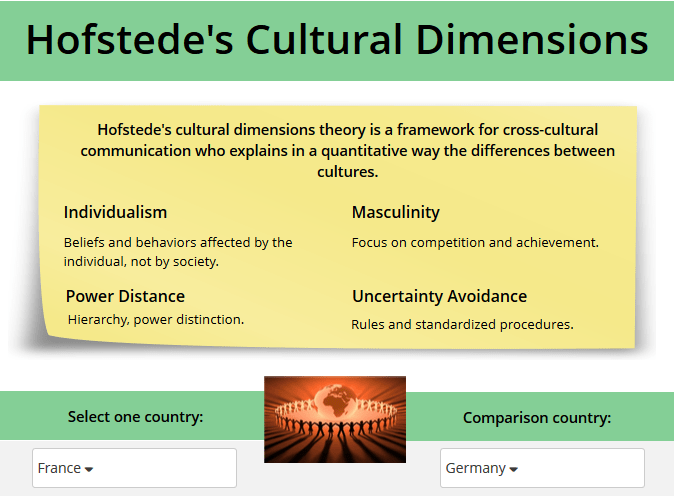
For example, if I compare Romania and France, here is what I get. As we can see here, the French culture is much more “individualist” compared to the Romanian one.
The culture differences between countries are explained as follows:
Individualism: Romania scores 30 for the IDV. This means that it is a collectivist society and that the identity is based on social network and people are integrated within their group. The family value is still important for Romanians. Unlike Romania, France scores high on the individualistic index. French take care of themselves and immediate family rather than belonging to a group.
Masculinity: France and Romania scores in MAS are almost the same. Both of them are considered relatively feminine society. French and Romanians “work to live” rather than “live to work”. Both cultures appreciate life and its little pleasures like going out with some friends in a park, having a good coffee, inviting friend over dinner, going to an exhibition or a theater.
Power Distance: Romania and France score high on this dimension which means that people accept a hierarchical order in which everybody has a place. The power is centralized and the information flow is hierarchical, so unequally distributed.
Uncertainty Avoidance: Both countries have one of the highest scores on UAI. In Romania we have rigid rules and procedures that must be followed. France is famous for having a heavy bureaucratric administrative system.
Feel Free to try it yourself!
#Happy Dashboarding on Hofstede’s Theory Dashboard!