2015-11-25As an executive or manager, you want to stay informed about the critical financial positions of your company. Ideal dashboards…
 2014-07-24If you never heard of the Hofstede’s theory, here is a little catch up for you. It is the first…
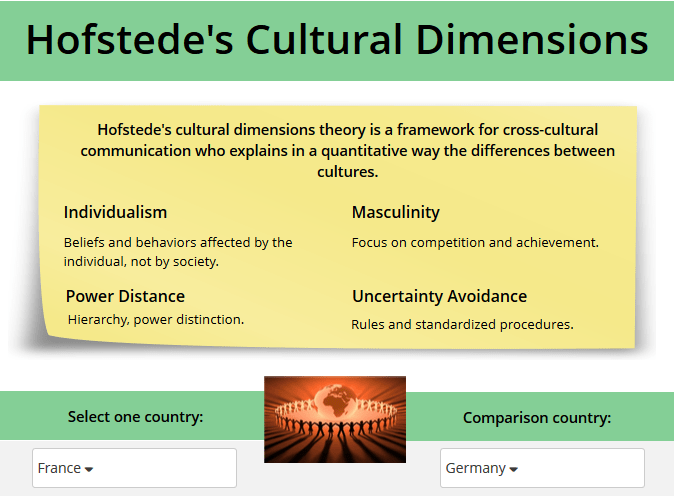
 2025-09-04How to ship a reliable, self-refreshing dashboard that keeps itself current If you are an end user of data and…
 2025-08-20Why export data to a notebook when you can forecast right where your metrics live? Many teams still use Jupyter…
- 2025-07-02A number of our marketing agency clients have told us they spend, on average, 2–3 days every month just wrangling…
- 2025-06-11A Sankey diagram is a flow diagram where the width of each connection is proportional to the flow quantity. It’s…
- 2025-06-11A bullet chart is a compact KPI visualization that compares a single measure against a target, along with performance thresholds.…
- 2025-06-11ETL (Extract, Transform, Load) and ELT (Extract, Load, Transform) are two fundamental approaches to preparing data for analytics and business…
 2024-10-28This webinar will give you the highlights of our latest releases with an introduction of all the key features. This…
- 2024-10-282024 was a big year for ClicData with 6 platform updates introducing big changes: 2 new modules such as Data…