
Dashboards & Reports
Describe your dashboard. AI builds it in seconds
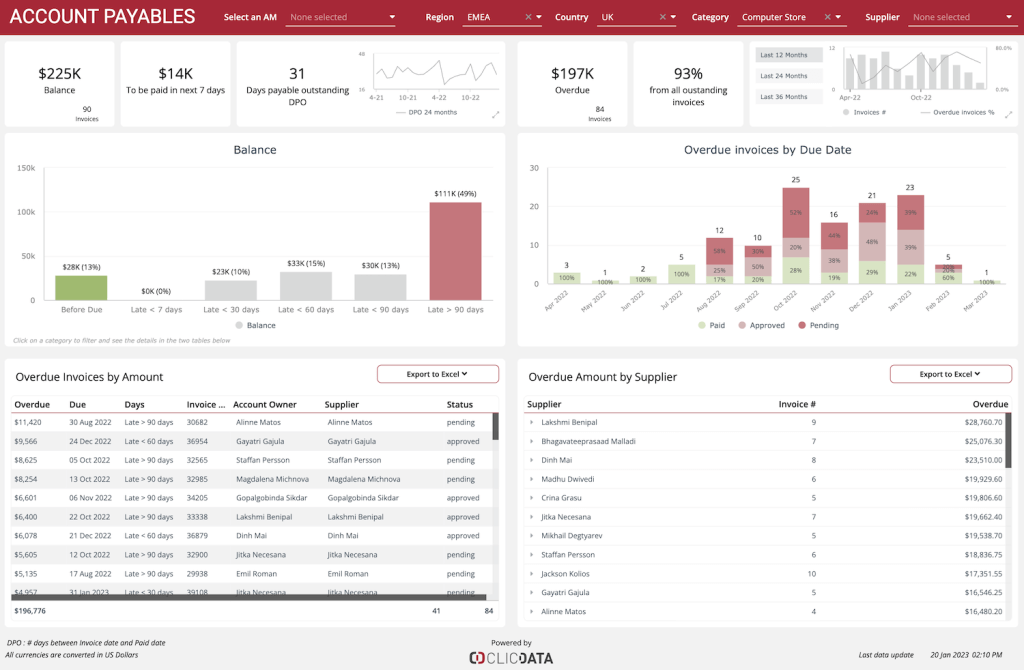
Account Payables
An accounts payable KPI (Key Performance Indicator) dashboard can be an essential tool for businesses to manage their financial health. This account payables dashboard template provides real-time data on a company’s accounts payable, which includes all outstanding bills that the...
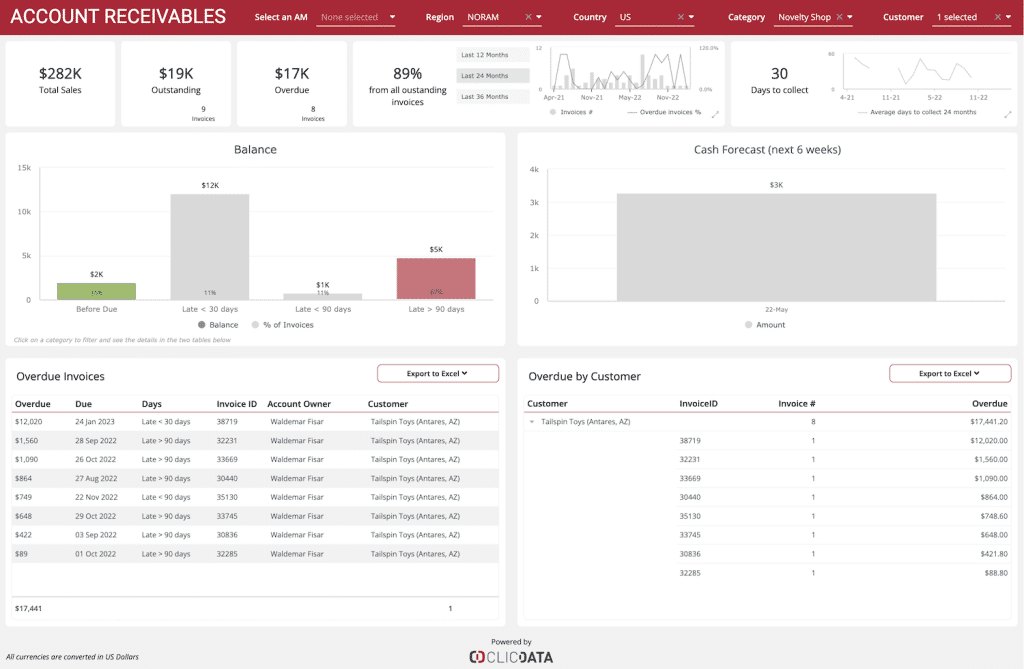
Account Receivables
This dashboard provides real-time data on a company’s accounts receivable, which includes all outstanding invoices that are owed to the company by its customers. By monitoring key metrics such as the average time to collect payments, the percentage of overdue...

Activities Individual Report
Monitor and Correct in real-time! Stay on top of what’s key to driving your business. Customer satisfaction, sales appointments, sales cycle, demos, and so much more. Your KPIs are only of value when they are measured and reported on. Real-time...

Actuals versus Budget
An actuals versus budget dashboard is a valuable financial management tool that helps businesses to manage their financial health. This actuals versus budget dashboard template provides real-time data on a company’s actual financial performance compared to its budgeted performance for...
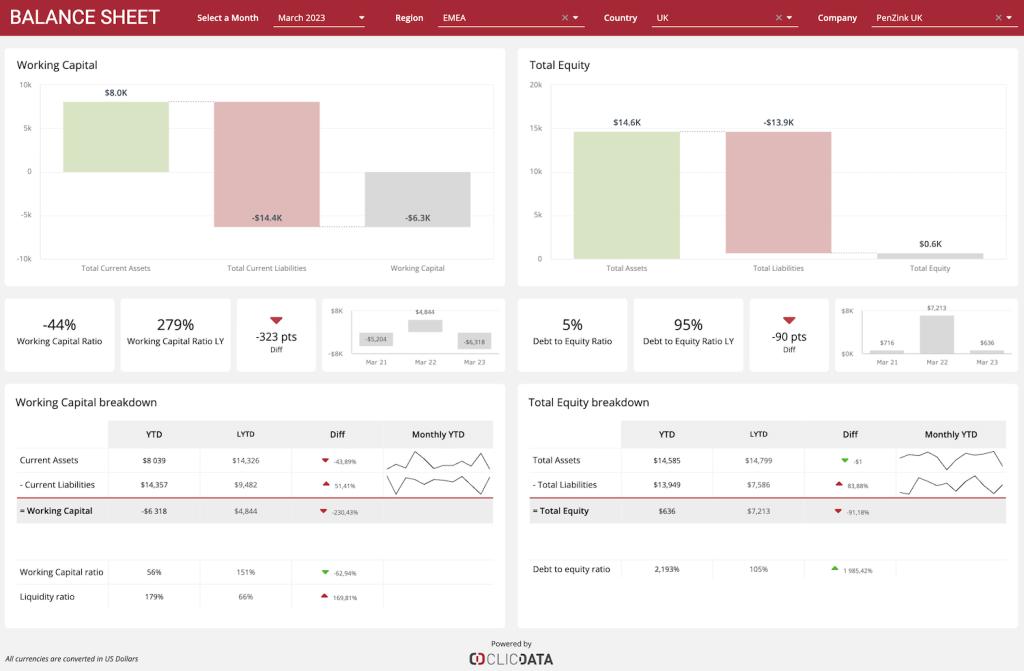
Balance Sheet
Monitor and analyze your assets, liabilities, and equity with this balance sheet dashboard. It provides a visual representation of your company’s financial position at a given point in time, including its current and long-term assets, debts, and equity. This balance...

Call Activity Per Campaign
This dashboard is mixing data from telephony or VoIP and CRM systems. It gives you extra insights into your team’s call activity. You can see who’s calling per campaign, who’s on track, and who’s falling behind compared to the team’s...
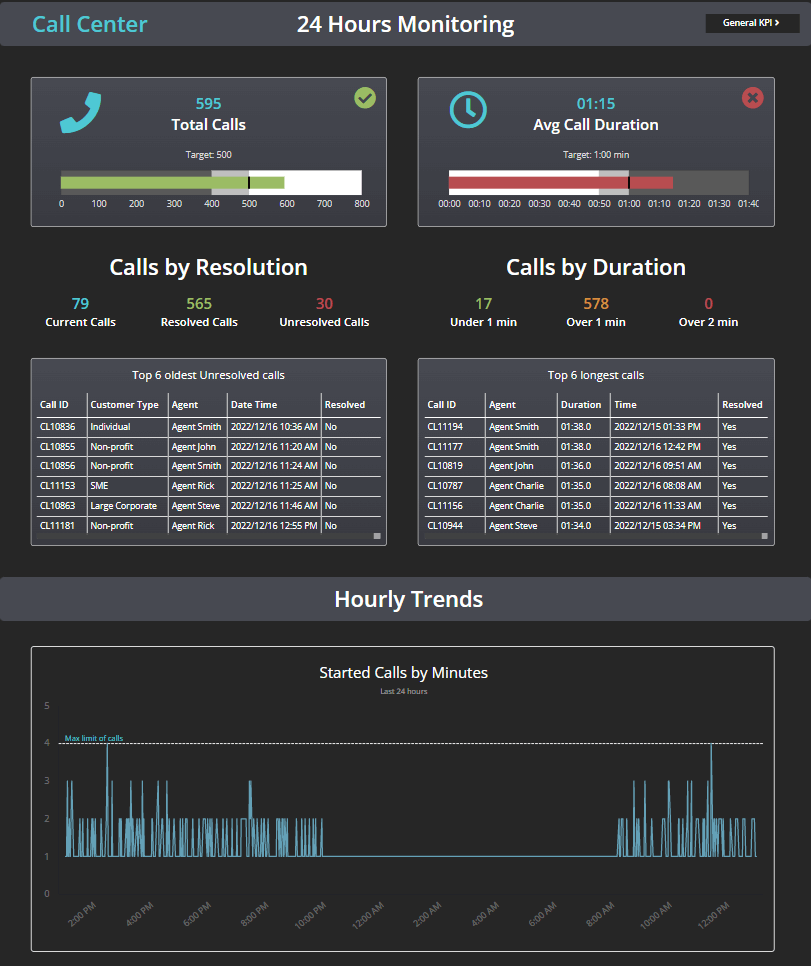
Call Center 24H Monitoring
Monitor your call center performance and key metrics with this dashboard template to ensure that calls are handled efficiently and effectively. Track your total calls, average duration, and more to spot emerging trends, optimize performance, and increase customer satisfaction.

Call Summary Report
Track your team’s call activity with this summary report. Have an overview of the call frequency, duration, response rate, and activity overview per BDM/AM and call type. This report goes beyond the built-in report in your telephony or VoIP system...

Call Target Activity Report
Get a quick overview of your team’s individual call activity against targets! Set alerts to know when BDR/AM goals are reached or not and easily compare performance to duplicate successes.
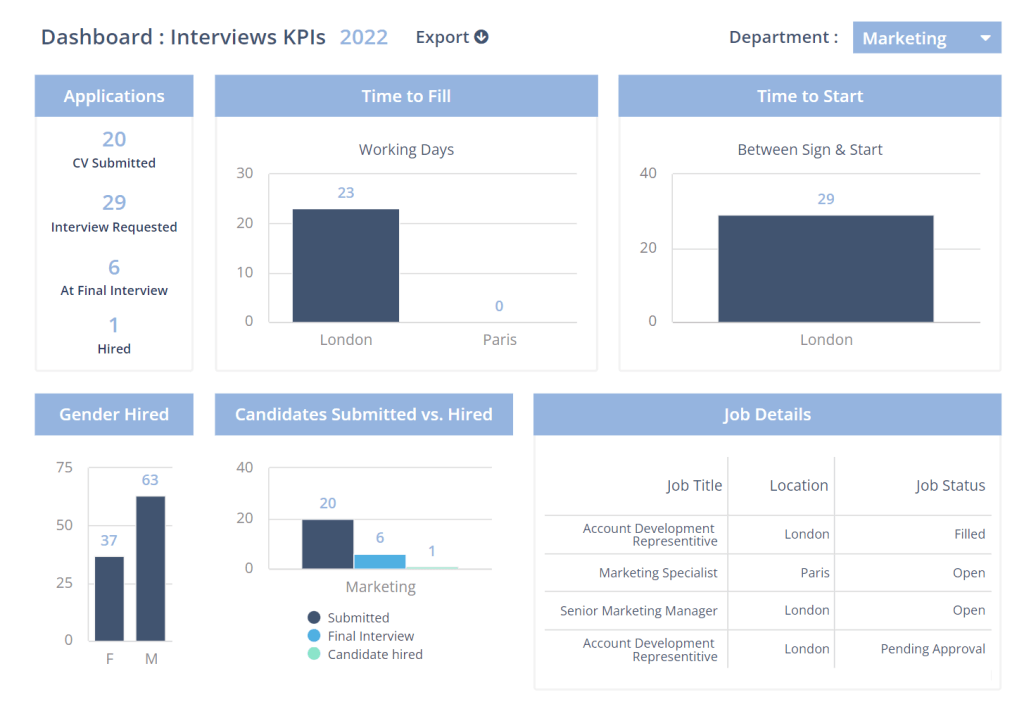
Candidate Interview KPIs Report
Track your overall recruitment process and keep an eye on job openings, applications received, processed, and candidates hired per month and department.