As an agency, we get that you’re all about making data-driven decisions to improve campaign performance and drive business growth for your clients. Working with so many channels, tools, and campaigns for each client means handling a lot of data.
And more often than not, the one common tool for bringing all of this data together is Excel.
While Excel spreadsheets can be a useful tool for storing and organizing data, they may not be the best choice for real-time analysis and collaboration. This is where a data analytics platform comes in, providing you with report dashboards that will impress your clients and save you valuable time (& billable hours).
Ready to dive into why marketing agency owners, like you, should consider using a data analytics platform? We’ve laid out three scenarios, that, let’s face it, you’ve probably lived through…
1. Increase your efficiency with a data analytics platform
Scenario #1:
It’s the summer and a client emails you urgently needing a report in an hour. Most of your staff are on holiday and you need to work on an important pitch. To keep your client happy, you need to export data from multiple platforms, format it, and input it into your standard report format. All of this takes time that you don’t have.
A data analytics platform automates many tasks that would otherwise have to be done manually in Excel. For example, it allows you to automatically generate up-to-date reports with accurate data without having to spend time manually copy/pasting what you need.
But that’s not all. With a data analytics platform, you can also have pre-built client report dashboards that connect to all your clients’ data sources, instantly. This means the data refreshes at set times and provides a live view of your clients’ performance so you don’t have to rebuild everything, every month, for each reporting meeting.
Now, your client would already have the shareable link to this report, taking away the time and effort needed for manual reporting.
2. Provide enhanced visualizations with report dashboards
Scenario #2:
It’s time for your monthly client meeting to review campaign reports with five stakeholders. You’ve spent a lot of time extracting the report information from multiple excel spreadsheets and adding it into your custom report template. Unfortunately, the agenda is bulldozed. They’re not happy with the report format. Kyle can’t see the connection between campaigns. Jenny is struggling to see the value in the metrics. Sarah can’t see the relationship between her business goals and these campaign metrics. You spend 45 minutes discussing how to make report improvements, leaving only 15 minutes to focus on the campaigns. The meeting has been derailed, the clients aren’t happy, and there’s no progress. It’s back to the drawing board – how can you combine these excel files into a report that satisfies all parties?
With a data analytics platform, you get a wide range of customizable visualization options, you can choose from to add to your report. They can combine data from multiple sources so you get a consolidated view of your clients’ performance.

Now, you’re able to present data in an easy-to-understand format to your clients, so they can make quick and actionable decisions for their business.
Plus, if they’re not satisfied with the visualization, you can easily make the changes without having to mess around with your Excel spreadsheets. By using a data analytics platform you’ll have time to dig deeper into the data insights available in the report dashboard and optimize campaigns.
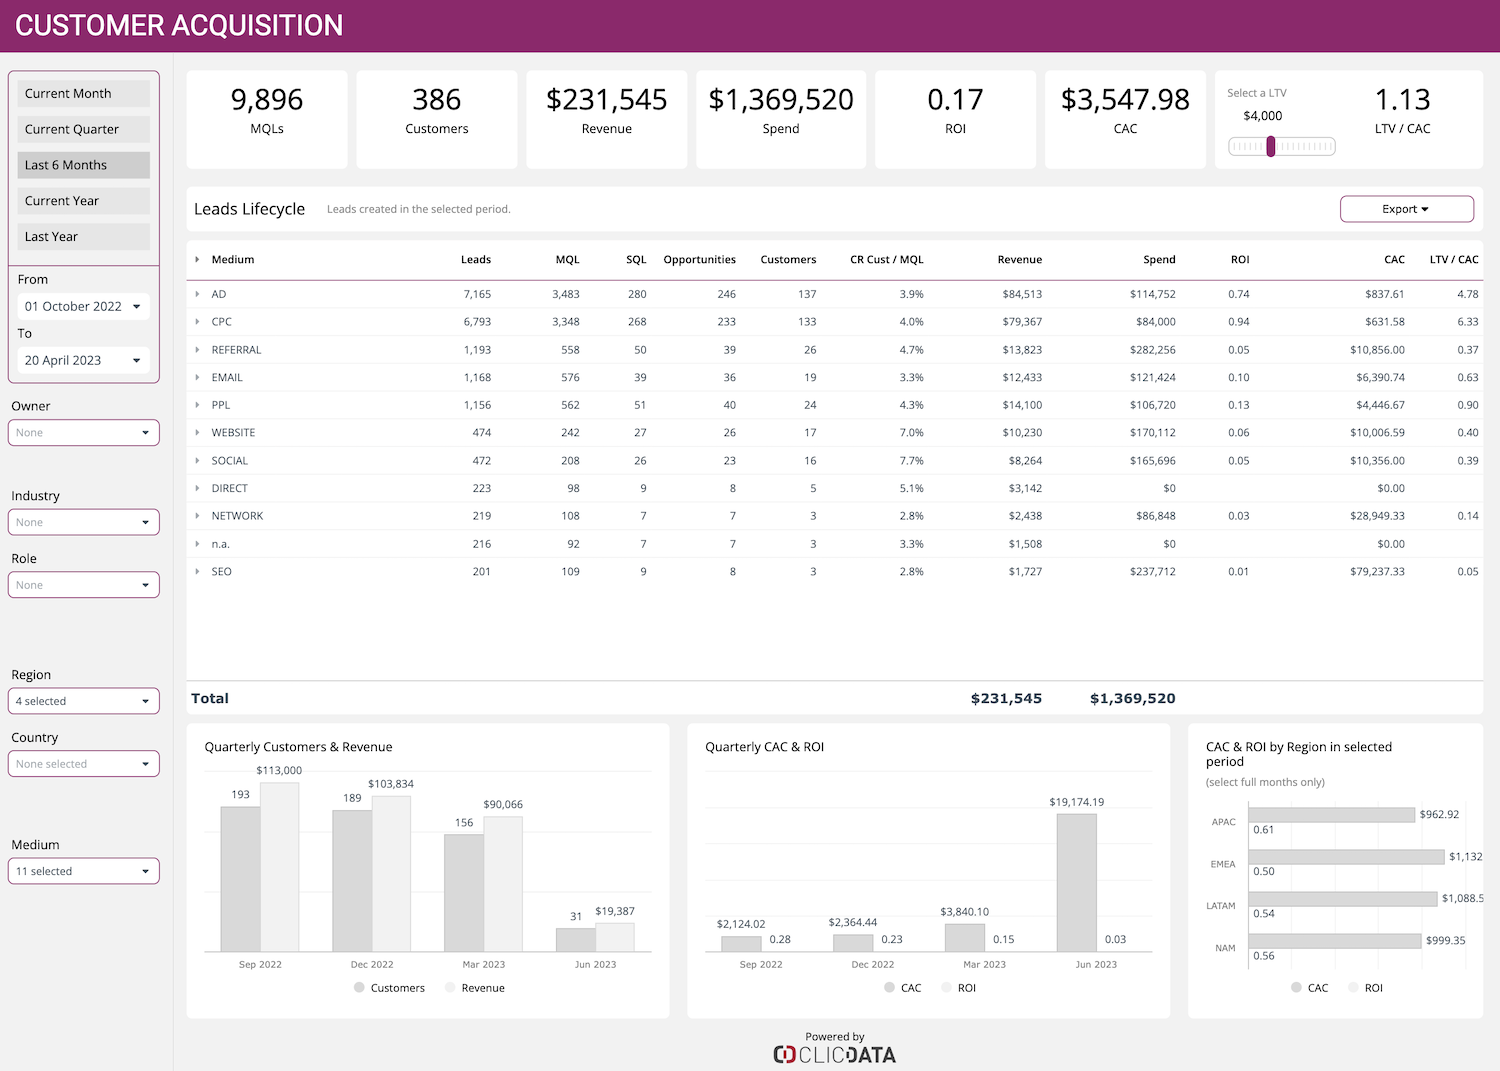
Let’s see an example of a dashboard that breaks down customer acquisition by channels:
3. A data analytics platform gives you improved accuracy
Scenario #3:
You are formatting multiple Excel sheets to prepare the data for a report. It took a while and a lot of concentration but it’s finally ready as one file to turn into the client report. Once your client receives the report they come back with a lot of questions, the report doesn’t seem to make sense. Unfortunately, when you accidentally used the wrong formula in one file, and forgot to export two key pieces of data in another. The report is wrong and your client relationship has been slightly damaged.
A data analytics platform connects your data and uses algorithms to analyze it. These platforms can also detect errors and inconsistencies in the data that might go unnoticed in Excel.
Here, using a data analytics platform would remove the manual element, reducing errors and giving you more time to focus on optimizing the campaigns and providing actionable insights to your clients.
Supercharge your clients’ campaigns with ClicData
Being able to work more efficiently with reduced errors is a huge advantage. You could increase your billable hours, improve client relationships, and supercharge your campaign results. The ClicData data analytics platform also allows you to white-label the tool and customize the appearance just like you do with your manual reports – and even better.
The benefits of using a data analytics platform are pretty clear, but we get that it can be daunting to move away from the familiarity of Excel. This is why we offer a free trial which comes with access to our support team who will help get you started, along with a library of 100’s of free marketing report dashboard templates.
Start your free trial now and supercharge your campaigns!