How would you determine if your store performance is trending in the right direction? Many elements should be considered: the sales actuals against targets, the customer engagement in the loyalty program, and the impact of your marketing campaigns on store footfall and revenue.
But when we talk with District and Store Managers or Franchise Owners, we see common pain points when it comes to tracking their store performance: no real-time data and no visibility in their sales numbers.
No visibility = no agility = store in jeopardy.
Agility is critical to stay even afloat but it’s still a luxury that too few of them enjoy. They “just” have access to real-time metrics based on data from their POS, budget spreadsheets, CRM, and marketing systems.
If that’s not your case, you’ve come to the right place. As a repeat consumer of our blog (pun intended), you know that we only offer practical guides to improve your reporting. In this one, you get three dashboard examples to:
- track sales against targets at the store level or group of stores,
- measure the customer engagement in your loyalty program,
- understand the impact of your local marketing initiatives on store performance.
Let’s do this!
What Dashboards Do You Need To Monitor Your Store Performance?
Before we dive into the good stuff, just a word on the best practices to build those dashboards. These three dashboard templates are complementary and will give you invaluable insights into your store performance when used together.
However, in order to be more efficient, we recommend building them one by one for a couple of reasons:
- to validate the capacity of the reporting tool to connect to your stores or ERP, CRM systems, and budget files.
- to ensure the quality and accuracy of the data in your reporting tool.
Now, the good stuff!
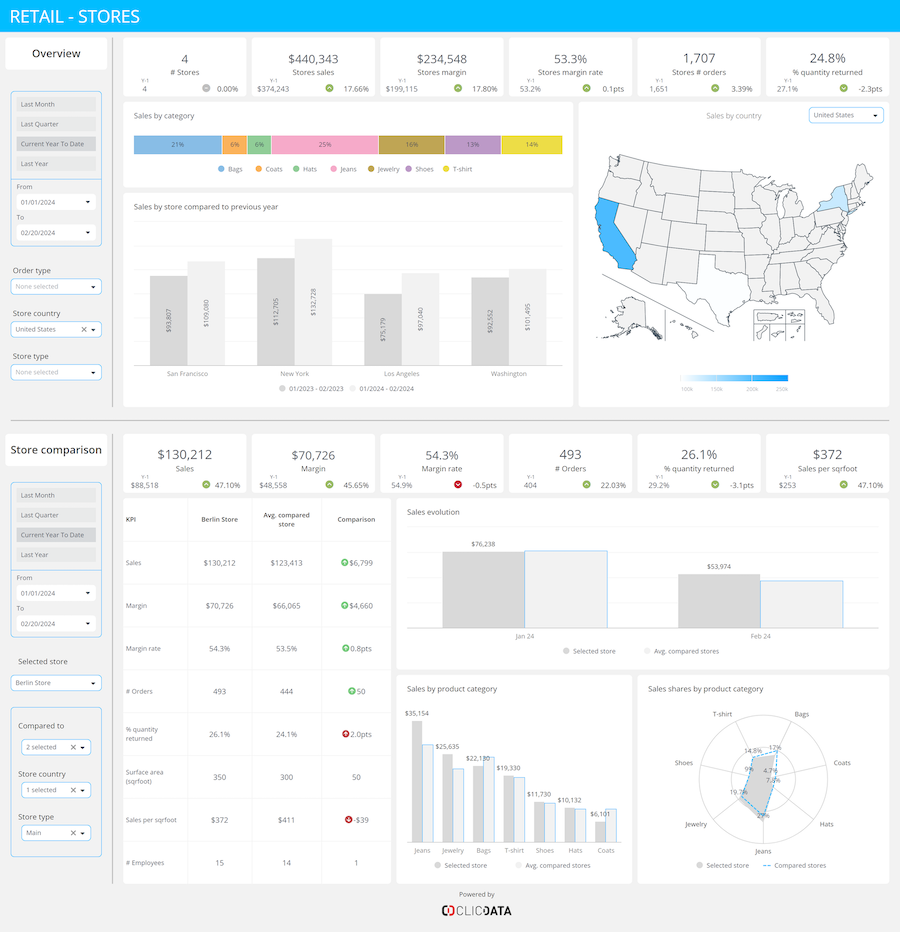
Store Revenue Performance Dashboard
What data do you need?
→ Store sales targets and store actual sales numbers.
Let’s start with the targets. They typically seat in an excel spreadsheet and are reviewed on a quarterly basis with the Store Manager. You need to see those changes reflect in your store sales dashboard.
The sales data usually sleeps in cash counters at the store level, or best case scenarios, in the company ERP.
Your reporting tool should be ale to fetch of all that data to build the following metrics:
- Sales revenue against target
- Sales variance: A high sales variance metrics reveals unrealistic goals that need to be refined. If the variance is high for only one store, then it means something’s clearly wrong with this particular location. It could due to customer interactions with staff, poor inventory management, or external factors such as the arrival of a new competitor in your store’s catchment area.
- Average transaction value
- Inventory turnover
- Sales per square foot
Once the data is consolidated, the next step would be building forecasting scenarios based on a number of factors such as pricing changes or special discounts.
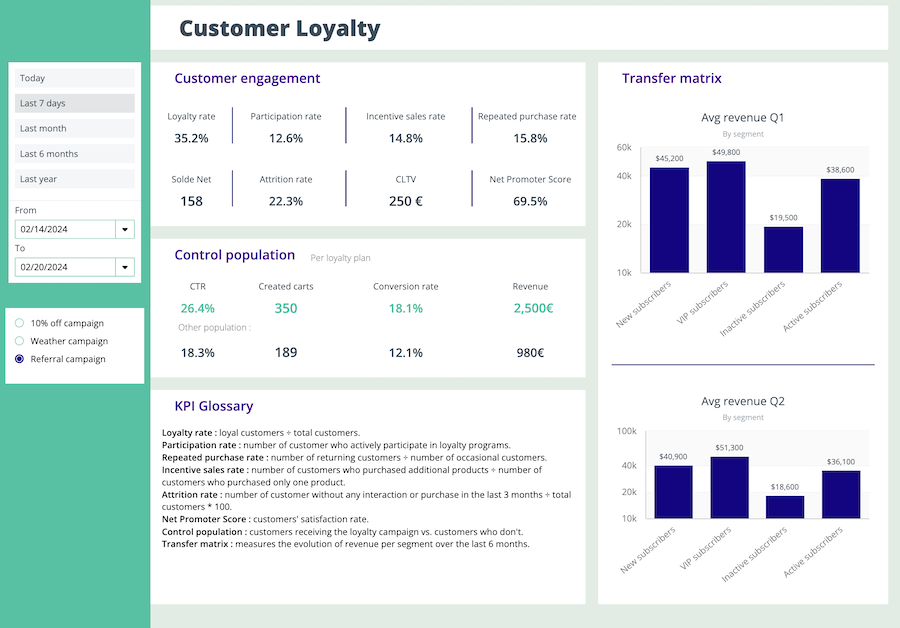
Customer Engagement Dashboard
What data do you need?
→ CRM, in-store application, IoT, point of sale system.
By capturing customer data and tracking interactions at various touch points including purchases, recommendations on an iPad, and in-store special promotions, you can create personalized experiences and enhance customer engagement.
Of course, the only way to tie everything together is through the input on the customer’s loyalty card at the check out.
By unifying your POS, CRM and IoT data you can measure:
- Repeat Purchase Rate
- Cross-Sell and Up-Sell Rate
- Engagement Duration
- Average Customer Lifetime Value (CLV)
- Net Promoter Score (NPS)
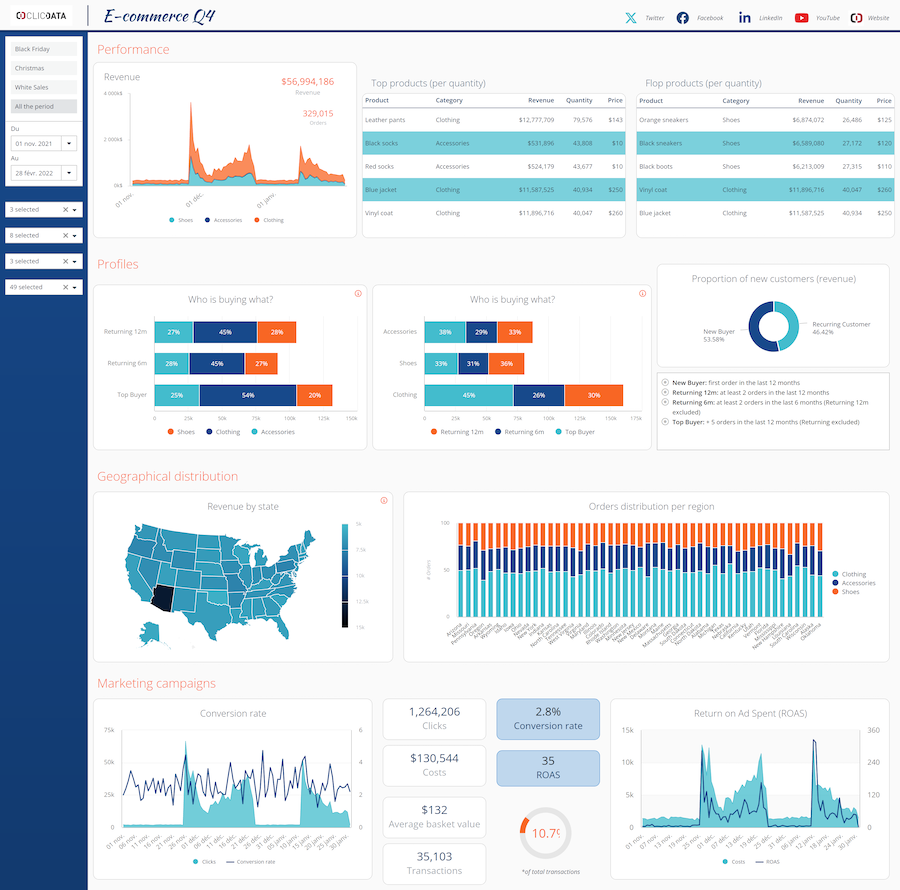
Marketing Campaign Performance Dashboard
What data do you need?
→ SMS, CRM or emailing, social media, ads.
Effective marketing campaigns are instrumental in attracting and retaining customers. Whether it’s email, SMS, calls, or local media promotions, monitoring campaign performance is essential for evaluating ROI and optimizing future initiatives.
By consolidating all your marketing acquisition channels into one dashboard, you will quickly identify the channels and the messaging that have a bigger impact on your store performance.
Here are some metrics you can measure with all that data in hand:
- Click-through rate (CTR)
- Conversion rate
- Foot Traffic Increase
- Coupon Redemption Rate
- Local Sales Lift: Calculate the incremental sales generated at the store directly attributable to the local marketing campaign. By comparing sales during the campaign period to historical data or a control group, you can quantify the campaign’s impact on driving revenue and overall store performance.
- Return on Investment (ROI)
Get a Holistic And Real-Time View of Your Store Performance With ClicData
Imagine having your sales actuals against targets, your customer engagement and loyalty and local marketing campaigns metrics in a set of dashboards shared with the corporate HQ and to each Store Manager, in real-time. Wouldn’t that be great?
That’s exactly what ClicData’s data analytics and reporting platform help you achieve. We’ve got an excellent track record in unifying data in the retail industry. You can check out our use cases here.
You could finally slice and dice your data to track your store performance per location or globally. You would also be able to understand the effectiveness of your marketing campaigns and accelerate on the right channels to stay ahead of the game.
ClicData can help you improve your store performance analysis with real-time dashboards