
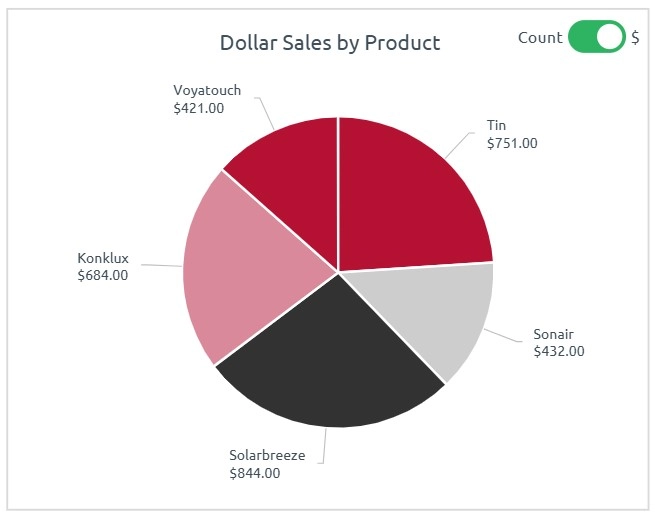
A pie chart is a circular graph divided into slices to represent numerical proportions. Each slice’s size corresponds to the value or percentage it contributes to the whole.
When to Use Pie Charts
- Show part-to-whole relationships
- Highlight one dominant category
- Represent static data with few components
Best Practices
- Use no more than 5–6 categories
- Label clearly or use legends if space is limited
- D