BI dashboards give insight into your business like nothing else. Become a fly on the wall inside any business and it won’t take you too long to see that business intelligence is often a comedic effort. As in, many businesses are tracking zilch! And others, well, they’re tracking everything. For the latter bunch, they’re doing it using tons of different methods, from Excel to custom scorecards to lists to Six Sigma.
This mixed-bag approach to data intelligence not only makes it a challenge for one business unit to converse with another in a way that makes sense, it also gives serious pause as to which “version of the truth” is…true. Second, it creates hours of extra work.
And finally, despite all these efforts and strategies, so many businesses continue to be caught off guard by major problems. They didn’t know that 25 percent of orders were delivered late; they had no idea that their attrition rates spiked after employees had been there three years; they were shocked to see that their competitors were innovating faster.
In today’s digital age where you can track just about anything, there are no excuses for not being in the know.
Don’t Be Caught by Surprise – Use BI Dashboards
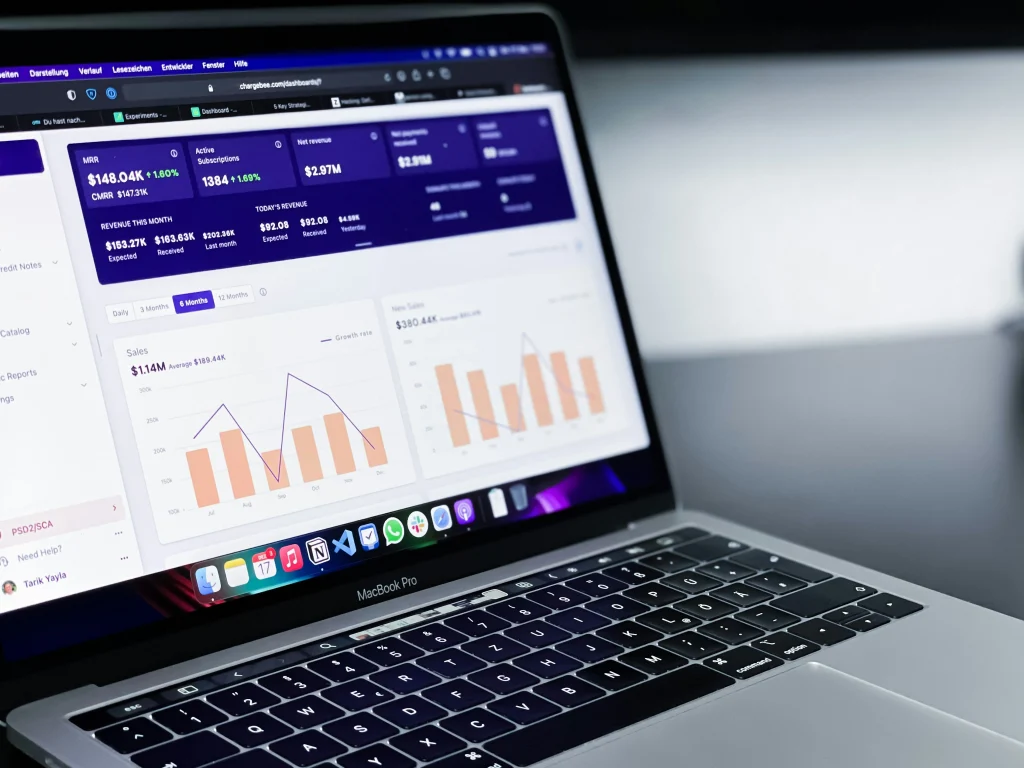
You can take a detailed look under the hood of your business just about any time—without wanting to pull your hair out. The answer: business intelligence dashboards. BI dashboards roll up all the nitty gritty details into one intuitive and friendly view.
The easier it is for you to check on your business’ key metrics, the less likely it is that you’re going to miss something.
Use BI Dashboards for Reporting
If your response is “Well, can’t I do this in Excel,” then you’re not thinking big enough. You can track data a lot of ways, sure. But you’ll be hard-pressed to find a method where you’re not manually entering data—or staring at a sea of black and white columns and rows that overcomplicate everything.
Automation is critical to avoid being caught off guard. The right BI dashboards are capturing and interpreting data in real-time, allowing you to view a snapshot of the health of your business, any time you choose. You’re not just seeing numbers, you’re seeing analysis and learning actionable insights. For example, if orders are down, you’ll know just how much they are down this quarter, this month, how they compare to last year and what product categories are in trouble. Want to dig deeper? Okay—the raw data is just a click away.
Define & Monitor Data Points with BI Dashboards
To create the most effective early warning system for your business, identify the data points that will tell you the real story. What exactly do you need to know—no matter how granular—to see early on that there is a potential wave coming your way? If you’re unsure how to answer this one, consider other problems you’ve faced. How did you feel in hindsight? What did you wish you had known?
BI dashboards allow you to track key metrics and create automatic tracking. Choose to receive reports or alerts daily, weekly or monthly. You will have the peace of mind knowing you’ve created the framework you need to effectively keep your eyes on your business and to be prepared for anything.
Visit the ClicData Homepage to learn more about BI Dashboards.