
2014 has been a very eventful year here at ClicData!
We started to showcase the application at trade shows and spreading the word to journalists and related web sites about it. We got to meet some of you in person to see what we can do better and how ClicData is being used around the world!
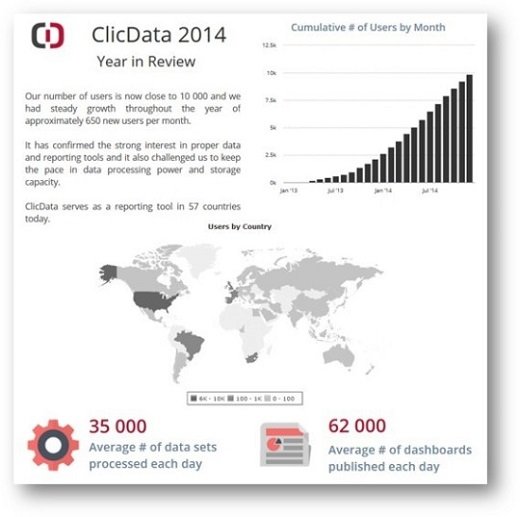
Over 10 000 people all over the world use ClicData for dashboards. Small and large businesses, non-profit organizations and schools are now creating reports and dashboards in an entirely new and simple way.
Check some of the numbers in the dashboard below, don’t forget that you can click on it to access it live like any other ClicData Dashboards.
2014 was also the year where we decided to undertake our biggest challenge to date, bringing you the next version of ClicData, code named “i4”, supported by a new infrastructure, numerous new features such as Teams and Users management for companies, intelligent cloud connectors, a new data loader and over 240 new features.
Although we are a little behind schedule, we are sure that you will be amazed by how far we have taken ClicData. To follow the progress and the launch schedule, you can check this page.
In preparation for this global launch, we have hired more staff capable of speaking more languages and increased our Support and Services team to make sure that if you ever need help, we have someone to help you. We have also secured some great partners to help us around the world with local needs.
If 2014 was a big year, 2015 will be even bigger: keep sharing your feedback and dashboarding experiences, every suggestion keeps feeding the development team, making the product grow stronger!
Thanks to all of you for making ClicData what it is and for your support. We wish all of you a great new year and Happy Dashboarding!
Telmo Silva
CEO of ClicData