
Dashboards & Reports

MRR Sales Performance
Uncover your MRR performance in real-time, spot trends, analyze churn, and identify growth opportunities like never before. Get all the metrics you need to boost your revenue generation in this pre-built dashboard template.
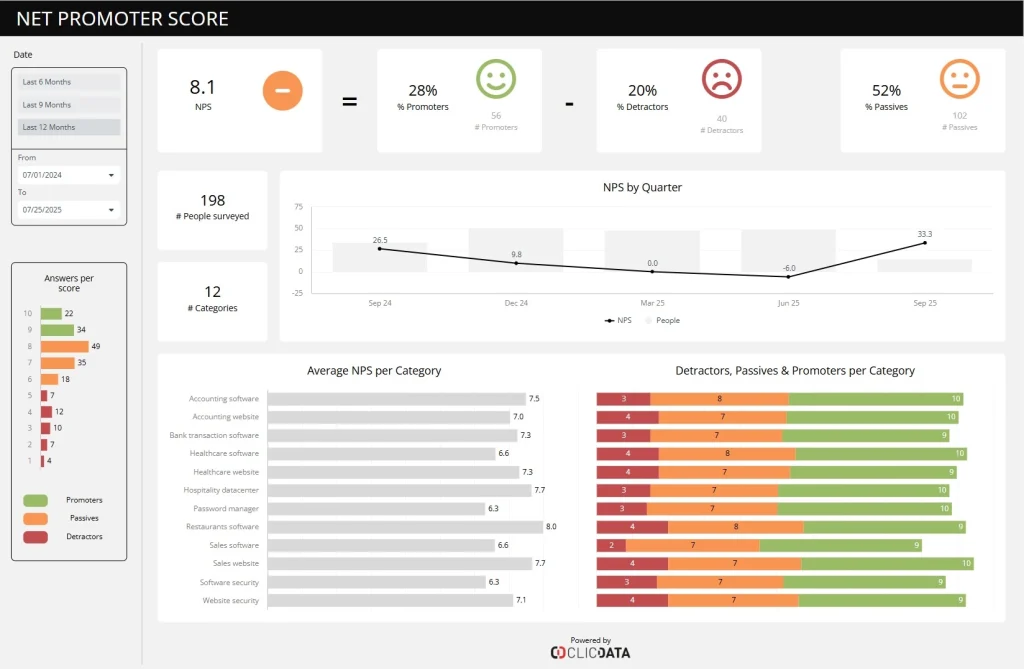
Net Promoter Score
This NPS dashboard tracks customer sentiment over time, displaying promoter, passive, and detractor breakdowns across multiple categories. It highlights NPS evolution by quarter and offers category-level averages to identify satisfaction gaps and loyalty drivers. A valuable tool for improving customer [...]

Opportunities Individual Reports
Sales Team and BDR Reporting: Turn weekly or monthly reports into hourly reports. Turn manual reports into automated reports. Design custom reports that can be used at every level. Segregate teams by region, product, goals… It’s your sales team, so [...]

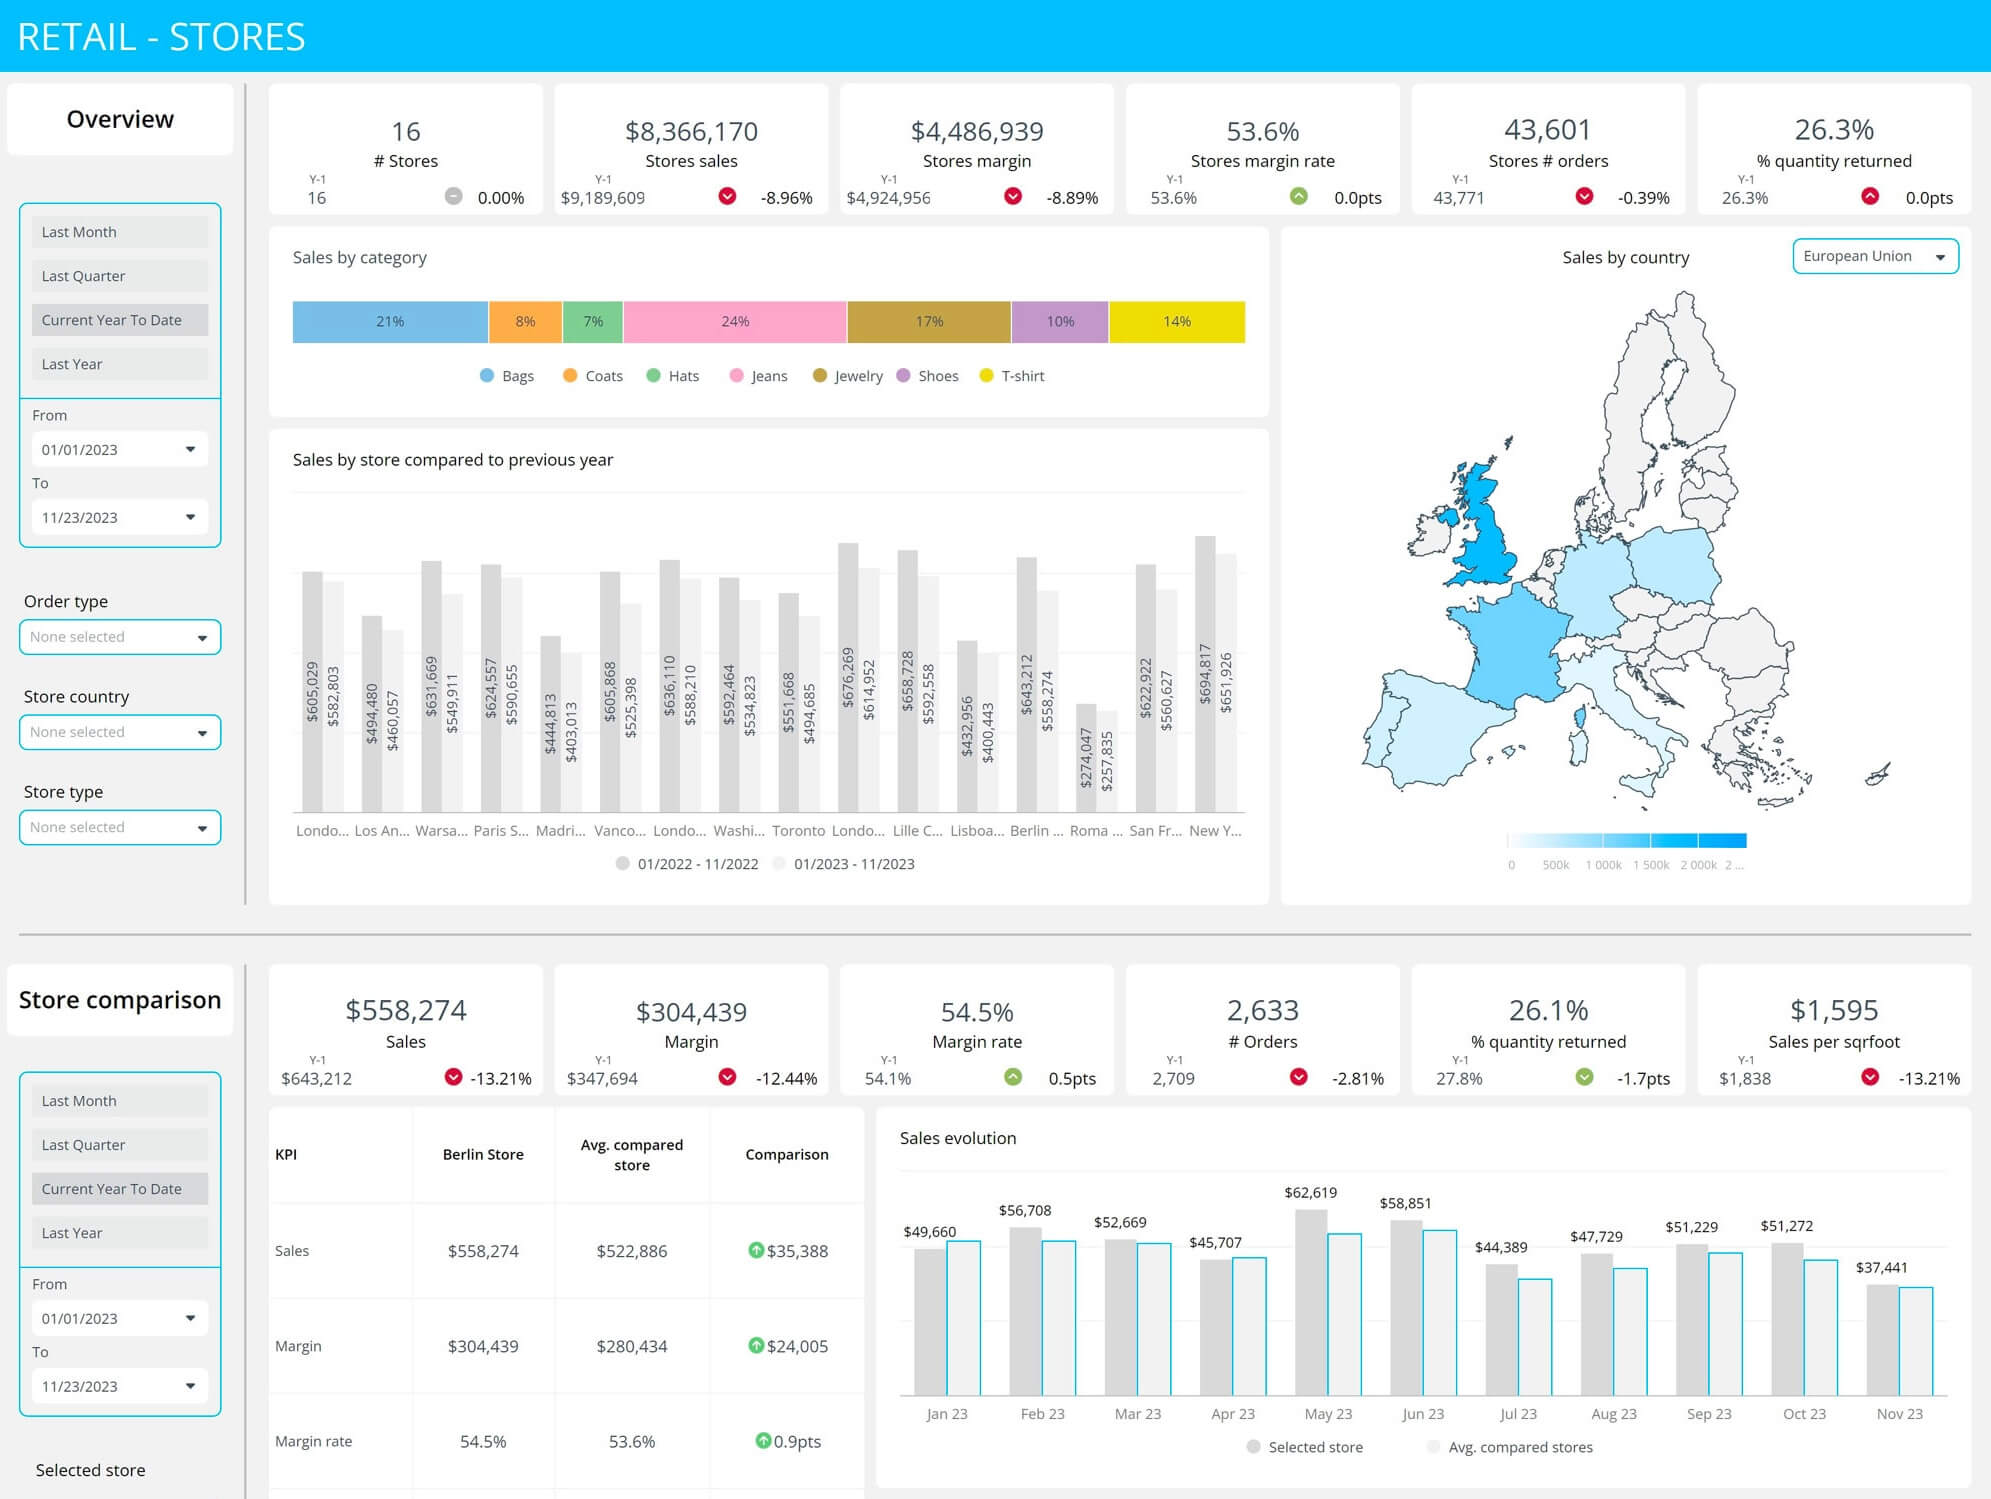
Orders and Financial Dashboard
This dashboard template gives you all kinds of information about the performance of your eCommerce stores, combining both your sales and financial data. Get a summary of your key KPIs: orders, revenue, net profit, shipping costs, and average order size… [...]

Performance By Email
Dig deeper into your email campaigns and see how your audience is responding to your communications. This dashboard gives you both an overview of your emailing campaigns and a detailed representation of the performance of your emails: opens, clicks, click-throughs, [...]
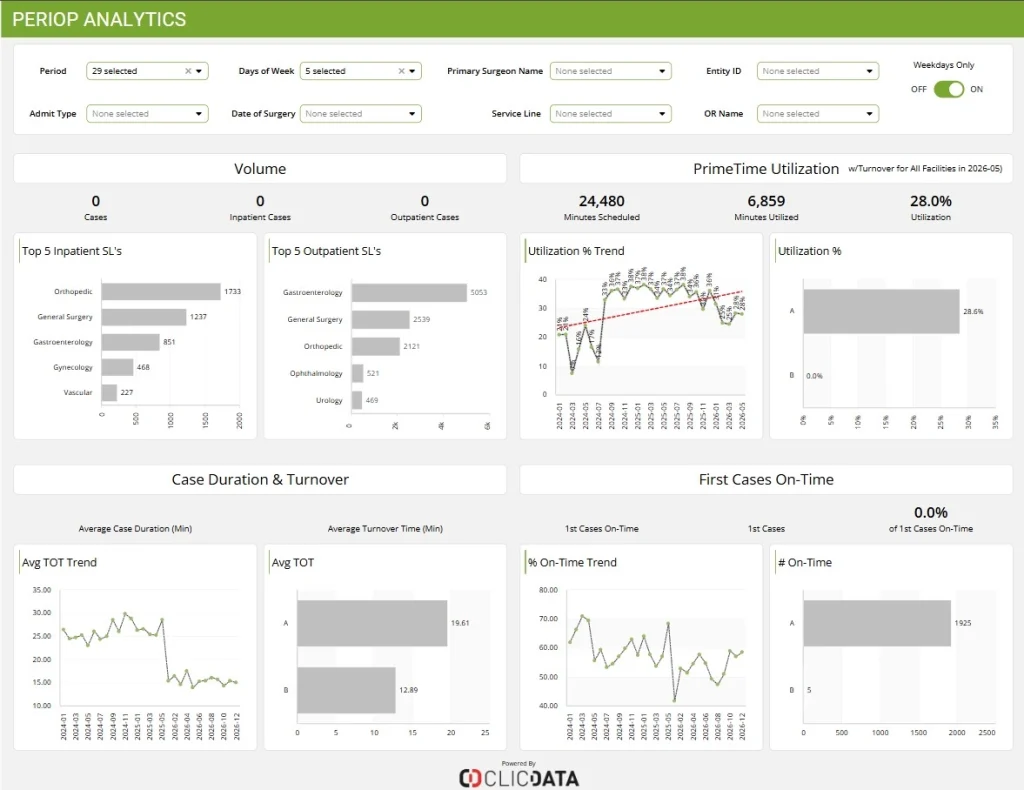
Periop Analytics
Periop Analytics provides visibility into surgical operations by tracking case volumes, utilization rates, turnover times, and on-time first case performance. With clear segmentation between inpatient and outpatient procedures, the dashboard helps uncover inefficiencies in OR scheduling and resource use. An [...]

Pharma Sales
Monitor your pharma sales performance by customer with quantities ordered, shipped, and delivered as well as a comparison between your revenue and target.

Pharma Sales Analysis
Get an overview of your pharma sales performance in this dashboard! Keep track of your quantity ordered, delivered, sold, and generated revenue. Filter by products, customers, and locations understand where you need to focus on.

Pharma Sales Force Analysis
Monitor your sales force effectiveness on a month-by-month basis with the number of rep visits, calls, and generated sales, all combined in a single dashboard. And the best thing is you can filter by year, month, rep, and location.
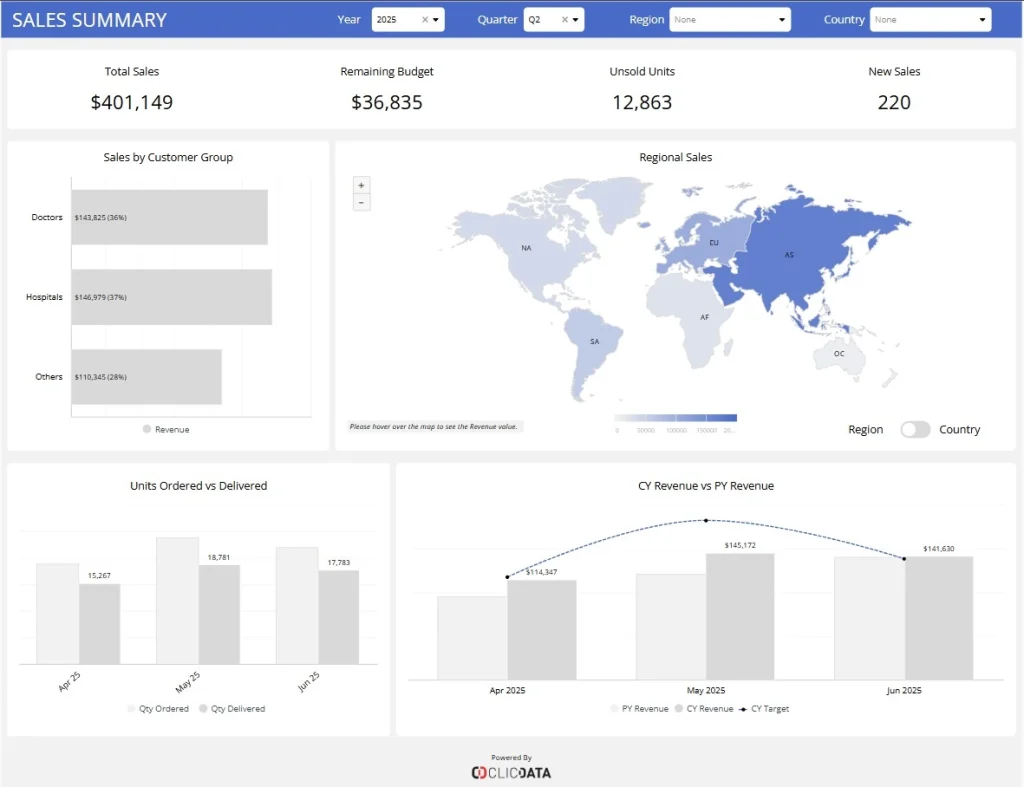
Pharma Sales overview
Track pharmaceutical sales performance with key metrics like total sales, new sales, and revenue by customer group. Visualize regional sales and monitor monthly order fulfillment and revenue trends. Perfect for sales managers aiming to drive growth and efficiency.