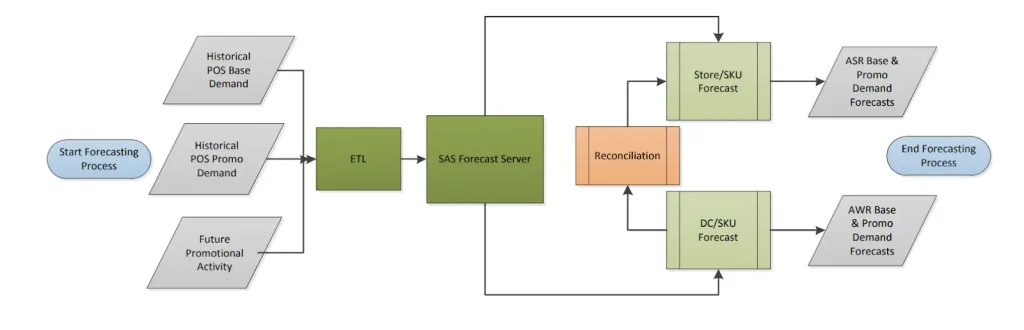
Why export data to a notebook when you can forecast right where your metrics live? Many teams still use Jupyter notebooks, spreadsheets, or manual workflows. They export data, run models in another system, then bring the results back into dashboards. This slows everything down, creates stale insights, and leads to missed opportunities.
KPMG’s 2025 report mentions that 40% of companies still use spreadsheets or manual processes for forecasting outside their BI tools.
But what if you could run your forecasts right where your data lives, inside your BI platform? With operational forecasting inside your BI platform, you can build and run models as part of your normal data pipeline. No need to switch tools or wait for updates.
In this article, we will look at how modern teams are:
- Cleaning and preparing time-series data inside their BI tools
- Embedding forecasting models directly using SQL or Python
- Injecting predictions back into dashboards, in real time
- Monitoring forecast quality with alerts and versioning
By the end, you will understand how to bring your predictive workflows closer to the people who need them without switching platforms.
The Cost of Disconnected ML Pipelines
When you use separate tools for data, analysis, and reporting, it creates problems that cost businesses time and money.
What Happens When Forecasts Lag Behind?
When data is exported for analysis, it can take hours or even days to return with forecasts. After you put those predictions back into your reporting tool, your forecasts might be based on data that is already old.
If sales data from yesterday only reaches your forecast model tomorrow, your predictions will always be a step behind. This “lag” makes it hard to make quick decisions. You need fresh insights to react fast in a changing market.
For example, Tractor Supply Company, a major U.S. retailer, was struggling with delays in its sales forecasting process. Their old system took too long to process sales data. This resulted in inventory decisions being based on outdated information. After switching to a real-time forecasting solution, TSC improved forecast accuracy by 9.6%, reduced stockouts, and optimized its inventory.
Why Does Data Movement Lead to Context Loss?
When you move data around, you often lose important details. For example, you might pull out total sales numbers, but lose information about which customers bought which products in which regions. The forecast comes back as a single number, disconnected from the parts of your business that actually matter.
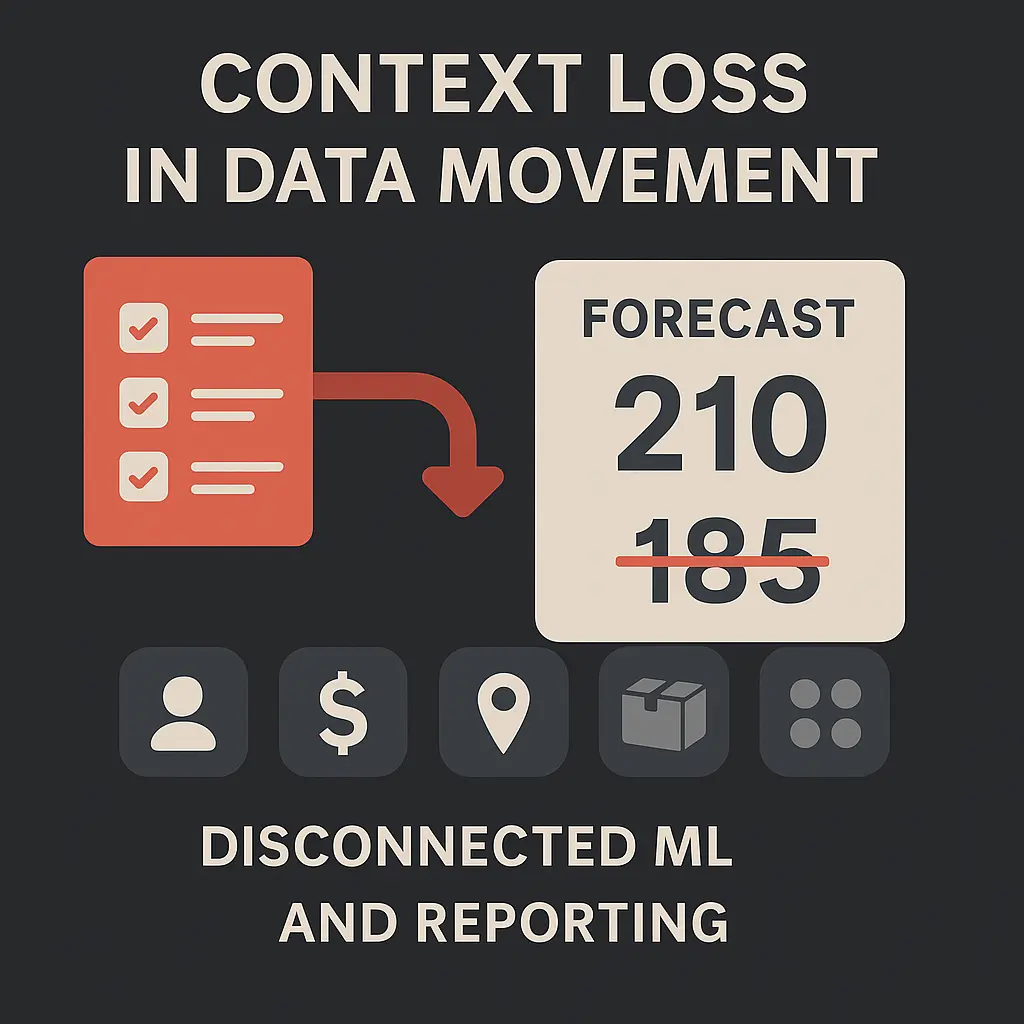
This loss of detail makes predictions harder to use. If a forecast says sales will drop but doesn’t show where or why, it’s difficult to act. Without context, you lose the full picture needed to respond with confidence.
Why Do Disconnected Pipelines Create IT Overhead?
When data, models, and reports all run in different systems, your IT team ends up carrying the weight. They need to manage complex data flows across cloud storage, Python environments, and external ML platforms, making sure everything stays connected and secure.
This adds time, cost, and risk. Extra integrations increase the chances of errors, slow down delivery, and raise concerns about who can access sensitive data.
A simpler approach is to run forecasting models directly inside your BI pipeline. By keeping the data in place, you eliminate the lag, preserve full context, and remove much of the IT burden.
Integrating Forecasting Models Directly Into Your BI Platform
Now that we understand the problems, let’s look at how to fix them. The key is to bring your forecasting models directly into your BI platform. This makes the whole process faster and more efficient. Here’s how you can set up forecasting directly in your BI workflow:
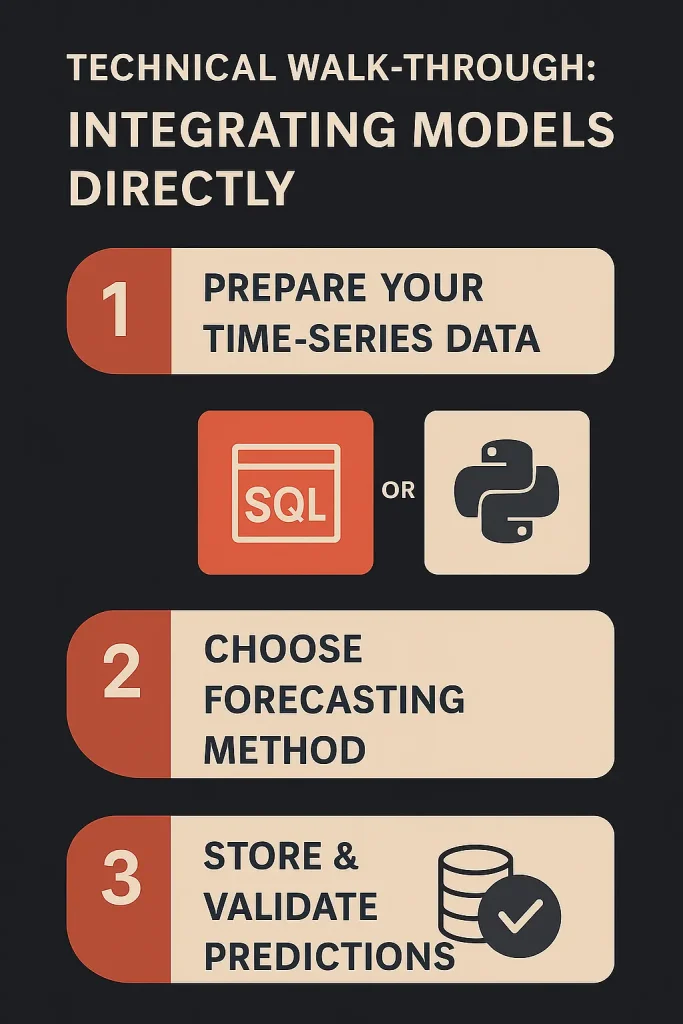
1. Foundation: Preparing Your Time-Series Data
Before you can forecast, your data must be prepared. Forecasting models rely on data that changes over time. This means you need a clear date or timestamp for each record.
Your BI platform is excellent for this. You can use its features to:
- Ensure Proper Formatting: Ensure that your date columns are formatted correctly.
- Handle Missing Data: Sometimes, you might have gaps in your data. Your BI tool can help you fill these gaps, e.g., by using averages or the last known value.
- Deal with Outliers: These are data points that are very different from the rest. Your platform can help you find and manage them so they don’t skew your forecasts.
2. Choose the Right Forecasting Method
Forecasting methods should be selected based on the type of data and the business question. Here are two common approaches:
SQL Forecasting for Quick, Repeatable Models
Some forecasts can be built directly with SQL. This works well for straightforward patterns, like steady growth or yearly cycles, using built-in functions to spot trends.
The main advantage is speed. Your data stays where it is, and SQL can handle moving averages, rolling trends, and basic time-series logic without moving datasets around. Even though SQL doesn’t natively include full statistical models like ARIMA, you can mimic some of their behavior through lag functions, differencing, and window calculations. This makes SQL a reliable option for fast, repeatable forecasts that slot right into your pipeline.
Python Forecasting for Advanced Scenarios
When patterns get more complex, SQL alone isn’t enough. That’s where Python shines. With its ecosystem of libraries like Prophet, it can model overlapping seasonality, holiday effects, and sudden spikes.
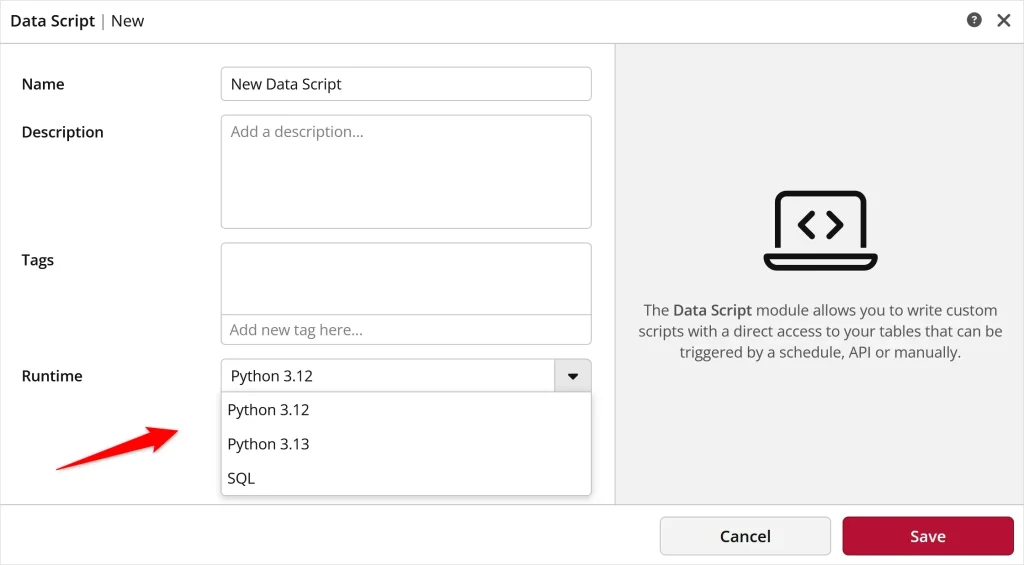
The difference now is that with ClicData’s Data Scripts, you don’t need to choose between SQL and Python or run them in separate environments. You can combine both inside the same platform. That means you can start simple with SQL for baseline trends, and then layer in Python for advanced forecasting — all without leaving your BI workflow.
3. Embedding Predictions Back into Fact Tables
Once forecasts are ready, they need to be stored. You can either append them to existing tables or create dedicated forecast tables. The key is keeping them tied to the original data.
For example, a sales forecast for “Product A in July” should link directly to “Product A” and “July” in your actual sales data. This makes it easy to compare your predictions with what actually happened. You can also track which model generated the forecast and when it was created.
Validating and Monitoring Forecast Quality
Forecasts are only useful if they are accurate. That is why it is important to check how well they perform over time. This will help build trust in your predictions and ensure that your dashboards stay reliable.
1. How Do You Back-Test a Forecast Model?
How do you know if your forecast model works? You test it on old data. This is called “back-testing.” You compare the forecast with actual results to determine how closely they align. If your model predicted past sales accurately, it is a good sign that it will predict future sales well too.
Common metrics to measure forecast accuracy include:
- MAPE (Mean Absolute Percentage Error): Reflects the average error as a percentage of actual values. Suitable for understanding the relative error size.
- RMSE (Root Mean Squared Error): Emphasizes larger errors by squaring them before averaging. Useful when big misses matter more.
Back-testing helps you fine-tune model parameters and avoid overfitting before deploying it in production.
With ClicData, you can easily display these metrics next to your actuals and forecasts. This gives you a clear, real-time view of your model’s performance.
2. How Can You Detect Model Drift?
Forecast models degrade over time, a phenomenon called model drift. It often occurs when underlying patterns shift, like changes in customer behavior, seasonality, or external shocks.
For example, if your forecast is off by more than 10% for a week, you might get a notification. ClicData’s dashboard capabilities can show these performance numbers clearly. They can also be set up to send you automated alerts, so you know right away if something needs attention.
3. When Should Models Be Retrained?
Forecast models learn from past data. As new data comes in, the model needs to learn from it too. This is called “retraining.” You can set up your system to automatically retrain your models.
This might happen daily, weekly, or whenever your forecast errors go above a certain level. Automated retraining keeps your models fresh and helps them adapt to new market conditions without requiring manual updates every time.
ClicData’s Seamless Forecasting with Embedded Scripting
Some BI tools now allow you to run scripts during data updates. This means you can clean data, run forecasts, and send the results to your dashboard. In ClicData, these scripts run behind the scenes during each data refresh with the Data Scripts feature, so your forecasts are always in sync with the latest numbers.
Here is how it works in practice:
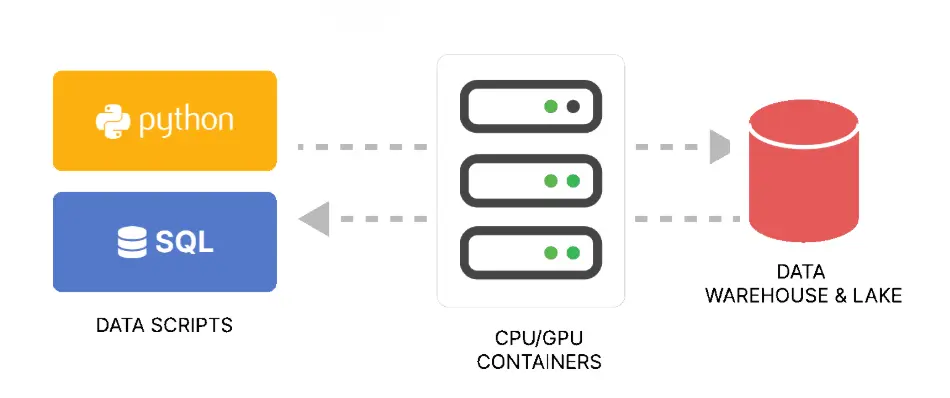
- Data comes in from your source (like a spreadsheet, database, or cloud app)
- Scripts run during the data load to clean, prepare, and forecast
- Results are saved into a table with your actual data
- Dashboards update instantly, showing both real and forecasted values
This setup gives your team real-time forecasts they can see and act on, without waiting for a data team or external tool. Additionally, it all occurs within the same BI workflow your team already uses.
Deploy Your First Forecast Directly in a BI Tool
Getting started with embedded forecasting is easier than you might think.
All you need is:
- A clean time-series dataset (like sales by month or website visits by day)
- A simple forecast script using Python
- A BI platform that supports scripting during data refresh
Upload your data, add a short forecasting script, and watch the predictions appear in your dashboard. This small step can make a big difference. Your team gets forecasts they can see and trust, without waiting or switching tools.
So if you’re new to ClicData, book a session with our team to get started, or join our upcoming webinar for a hands-on demo on using Python and SQL scripts directly within the platform.