Dear ClicData Users,
Here we are, two months after the launch of ClicData i4, our next gen “data and dashboard reporting solution”!
It is going fast and we are working even faster to make sure that we can transition our i3 users into i4 so that they too, can take advantage of the new features as soon as possible.
ClicData i4 has taken us to a new level with new features such as our easy data transformation designer, centralized team and user management, custom user and team parameters, faster data processing, and much more.
The interface is simpler and allows for more customization. You can make it your own by creating your custom domain and add your own logos too!
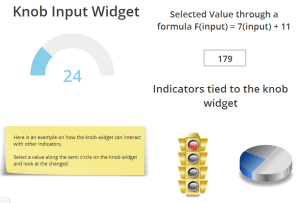
We have been working hard to bring the same capabilities as i3, we know that we need more widgets and they are coming! By the end of July we will have 5 new widgets including a new date range selector, a first release of the simple table and a regional map widget.
Our drill down table widget will bring new visualization options such as spark lines, bullet charts and conditional formatting to each cell!
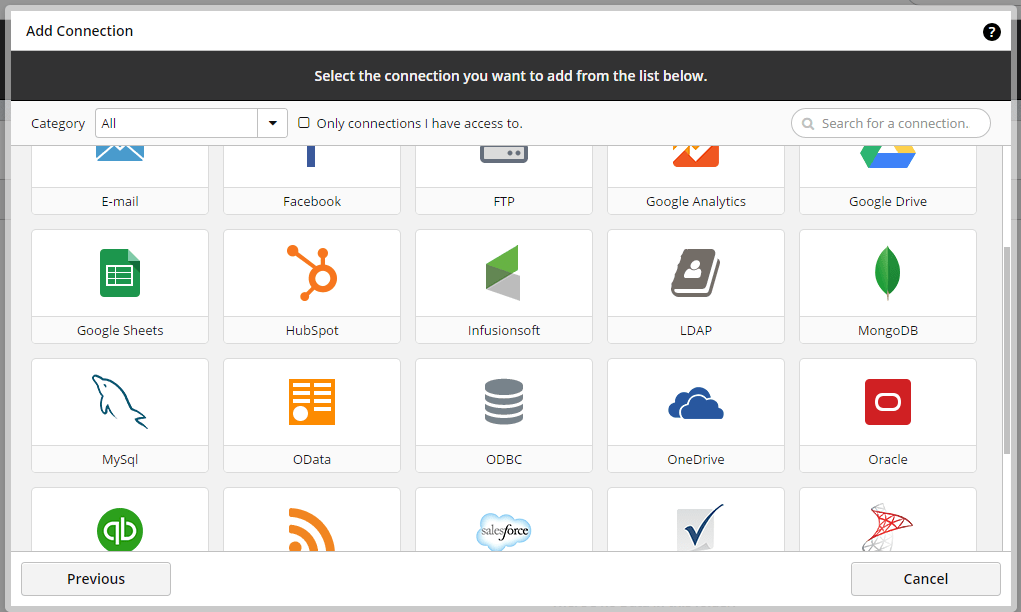
We have also added connectors to amazing applications such as HubSpot and Infusionsoft as well as Big Data connectors to MongoDB and Google BigQuery. Now you can visualize Big Data directly in ClicData while using the power of NoSQL or Big Query to store and access summarized data. We will continue to improve the QuickBooks connector and bring FreshBooks, an amazing invoicing application, to the catalog of “plug & play” ClicData connectors.
We also improving our existing connectors such Smartsheet, Google Analytics and Facebook, making them smarter and faster.
But more importantly, is the response we got in just 2 months from you! Over 2100 users have signed up with ClicData already! Here are the top 4 reasons why:
ClicData was designed from the ground up to support these needs and that makes our team really happy!
We have planned to push 6 more updates before the end of the summer and we count on your feedback to deliver the best cloud BI app ever!
Thank you for your continued support and Happy Dashboarding!