Executives don’t distrust your time series data because the SQL is wrong. The SQL is usually fine. The problem is that last quarter’s numbers changed between the July board meeting and the September review, and nobody told them why.
Trust breaks down at the explanation level, not the query level.
Gartner’s figure for the annual cost of poor data quality is $12.9 million per organization. But that number understates the real damage. When executives stop trusting the numbers, they stop using them entirely. Decisions revert to gut instinct. The BI investment becomes wallpaper.
This guide covers why technically correct time series queries fail at the executive level, where the trust gaps show up, and how to build SQL-based time series analysis that delivers decision-grade insights.
What Is a Time Series?
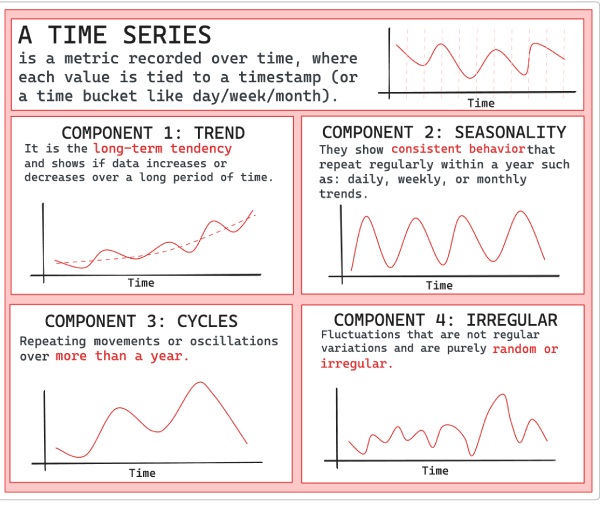
A time series is a metric tracked over time, where each value is tied to a timestamp (or a time bucket like day/week/month). In business reporting, that usually means one number per period, with two things nailed down: a fixed definition (what’s in/out) and a fixed timestamp rule (which date “counts”). That’s why “Revenue by month” can mean invoice date, payment date, or recognition date, and why “Active users” changes depending on whether trials, employees, or test accounts are included.
Time series combine four components: trend, seasonality, cycles, and irregular variation. You can check each of them in the following diagram:
Why time series behaves differently in real companies
A time series isn’t just a line chart. It’s a promise that the story stays coherent across reviews. The catch is that most business time series have two clocks:
- Event time: when the activity happened (purchase date, usage date, shipment date)
- Processing time: when your systems learned about it (late transactions, backfills, corrections)
If you don’t make those clocks explicit, you can ship a perfectly correct query and still lose the room the moment last quarter’s number shifts. For a deeper refresher on business time series, check ClicData’s guide on time series analysis.
Why Executives Question Time Series Data
Three issues consistently break executive confidence.
- Historical data moves. Late-arriving transactions post to previous periods. Revenue recognition adjustments land weeks after close. The Q2 number you showed in July won’t match the Q2 number in September because the underlying data legitimately changed. Executives don’t see “normal data latency”, they see numbers that can’t be pinned down.
- Metric definitions fragment. Sales tracks revenue one way. Finance tracks it another. Both build time series dashboards with the same label but different numbers. The CFO sees conflicting charts in the same meeting and starts questioning everything. Once that skepticism takes hold, it spreads to every dashboard you produce.
- Context goes missing. A SQL query returns numbers, but executives need to know whether those numbers are final, when the refresh happened, and what got included or excluded. Without that context, every trend line becomes a question mark. Is this number safe to put in the board deck? Nobody knows for certain.
Accuracy and Trust Are Not the Same Thing
This distinction trips up a lot of data teams.
Accuracy means the SQL logic is correct. Given the inputs at query time, the math checks out.
Trust means executives believe the numbers will behave consistently tomorrow, that someone can explain them when challenged, and that they’re stable enough to support a real decision.
You can have accuracy without trust. Most organizations do.
Your pipeline reprocesses historical data nightly to pick up late-arriving transactions. The SQL does precisely what it should. But to an executive looking at a dashboard, last Tuesday’s revenue just changed with no documentation. Technically accurate but useless for decision-making.
“If data is not trusted, it may not be used correctly to make decisions.”
— Gartner, 2024 Data and Analytics Trends
The goal isn’t just accurate time series, it’s decision-grade insights that executives can confidently present to boards, use for resource allocation, and commit to in forecasts.
Four Failure Modes That Kill Executive Confidence
Before jumping to solutions, it helps to catalog how time series analysis breaks down in practice.
Failure Mode #1: The Shifting Baseline
July’s board deck showed 15% year-over-year growth. August’s deck shows 12% for that same historical period.
Baseline data got reprocessed. Adjustments hit. Late transactions shifted the denominator. SQL behaved correctly both times.
Executives remember the number you told them. When it changes without warning, they assume either the original was wrong or the current one is. Neither assumption helps you.
Failure Mode #2: The Metric Mismatch
Finance’s dashboard says Q3 revenue was $4.2M. Sales’ dashboard says $4.8M. Both are labeled “Revenue.”
Different teams, different query logic. Gross versus net. Recognized versus booked. Including versus excluding certain transaction types.
Which number should executives believe? They’ll pick whichever supports their existing view, or dismiss both and trust their gut instead.
Failure Mode #3: The Invisible Refresh
Dashboard says data is through “yesterday.” Pipeline actually failed two days ago.
Nobody caught the failure. Dashboard renders fine. Numbers look current but they’re stale.
Tuesday’s decisions, based on what everyone thought was Monday’s data, were actually based on Saturday’s data. Bad outcomes follow.
Failure Mode #4: The Unexplained Anomaly
Sudden spike in a time series chart. Executives ask what caused it. Data team has no answer.
The spike is real. Could be a data quality issue. Could be a one-time event. Could be a genuine trend shift. Nothing’s documented, so nobody knows which.
Executives can’t interpret signals without context. The chart becomes noise instead of insight.
Common Missteps That Erode Trust
These patterns show up repeatedly in organizations struggling with executive confidence in their data:
- Treating BI tool calculations as the source of truth. KPI formula lives inside a dashboard widget? It’s invisible and unreviewable. Move the logic upstream into SQL or a semantic layer where it can be versioned and documented.
- Skipping documentation until “later.” Later never arrives. Document metric definitions and known limitations before shipping the first dashboard. If you don’t know the caveats, neither will the executives relying on your numbers.
- No clear ownership for metrics. When everyone can edit and nobody decides, definitions drift. Every business-critical KPI needs an owner who can resolve conflicts and approve changes.
- Ignoring late-arriving data. Pretending all data arrives on time doesn’t make it so. Build your pipelines with the assumption that some data will always be late, and surface that reality to stakeholders.
Building Time Series SQL That Earns Trust
Better SQL won’t fix trust problems. Governance will. Validation will. Transparency will.
Here’s what that looks like in practice.
#1 Centralize Metric Definitions
Every metric in a time series report needs exactly one definition: documented, versioned, enforced.
“Revenue” can’t mean different things in different queries. Define it once:
-- revenue_definition.sql
-- Definition: Net revenue after returns and discounts
-- Owner: Finance Analytics
-- Version: 2.1
-- Last updated: 2025-01-15

WITH revenue_base AS (
    SELECT
        order_id,
        order_date,
        gross_amount,
        returns_amount,
        discount_amount,
        gross_amount - COALESCE(returns_amount, 0) - COALESCE(discount_amount, 0) AS net_revenue
    FROM orders
    WHERE order_status = 'completed'
      AND is_internal_test = FALSE
)
SELECT * FROM revenue_base;Reference this definition everywhere. CFO asks “what’s included in revenue?” You have one source to point to.
In ClicData: Data Script SQL lets you define KPIs once and reuse them across every dashboard. No conflicting versions of “Revenue” floating around different reports. The definition lives in one governed location, and every downstream dashboard inherits it. The Modular SQL guide covers this pattern in depth.
#2 Implement Bi-Temporal Tracking
Bi-temporal modeling tracks event time (when the business event occurred) separately from processing time (when the data arrived in your system).
Why bother? Because it lets you reconstruct what you knew at any point in time, and explain exactly why numbers changed.
-- What was Tuesday's revenue as known on Friday?
SELECT event_date, SUM(net_revenue) AS revenue_as_of_friday
FROM revenue_facts
WHERE event_date = '2025-01-21'
  AND processed_at <= '2025-01-24 23:59:59'
GROUP BY event_date;Numbers changed between Wednesday and Friday? Bi-temporal tracking tells you exactly why. Late-arriving data came in during that window. That’s a real answer, not a shrug.
#3 Add Validation at Every Stage
Catch data quality issues before executives discover them in dashboards.
-- Revenue should never be negative at daily grain
SELECT event_date, SUM(net_revenue) AS daily_revenue
FROM revenue_facts
WHERE event_date >= CURRENT_DATE - INTERVAL '30 days'
GROUP BY event_date
HAVING SUM(net_revenue) < 0;
-- If this returns rows, block the pipeline and alertAutomate schema tests for expected columns and types. Data tests for row counts and NULL checks. Business rule tests to catch values outside expected ranges.
In ClicData: Data quality rules run automatically. Anomalies get flagged before anyone sees them, not after the board meeting. You define the rules once, and ClicData enforces them on every refresh. The data pipelines guide covers validation patterns in more depth.
#4 Version Your Transformations
Track every change to metric logic. Document what changed. Keep old versions accessible.
Use Git for transformation code. Maintain changelogs:
## Changelog: Revenue Metric

### v2.1 — 2025-01-15
- Changed discount handling: now excludes loyalty rewards
- Impact: Revenue increases ~2% vs. previous definition
- Approved by: CFO

### v2.0 — 2024-11-01
- Added filter for internal test accounts
- Impact: Revenue decreases ~0.5%
- Approved by: Data Governance CommitteeExecutives ask “why did revenue change?” You show them the specific change, the date it happened, and who signed off. No ambiguity.
#5 Surface Data Freshness and Lineage
Every time series dashboard needs to show when data was last updated, whether current periods might still receive late adjustments, and where the numbers came from.
Don’t bury this in documentation that nobody reads. Put it on the dashboard itself.
For periods that commonly receive late-arriving data (current month, for example), add a visual indicator like a yellow warning, a “provisional” label, or something that tells executives not to treat the number as final yet.
In ClicData: Dashboards display when data was last refreshed. Alerts fire when refresh jobs fail or data arrives late. Executive wants to know how something was calculated? One click to see the full lineage.
A Framework for Trust-Building
| Layer | Purpose | Implementation |
| Source | Reliable, governed data access | Cataloged sources, defined SLAs, change capture |
| Staging | Standardization and quality | Bi-temporal tracking, automated validation |
| Business | Metric definitions and logic | Centralized, versioned, documented definitions |
| Presentation | Executive-ready dashboards | Freshness indicators, lineage links, anomaly annotations |
Each layer adds a trust signal. Skip one and you open a trust gap.
How ClicData Delivers Decision-Grade Insights
ClicData sits between your SQL queries and your executive dashboards, adding the governance layer that raw SQL can’t provide on its own.
Define KPIs once in Data Script SQL and reuse them everywhere, no more conflicting metric versions across teams. Set validation rules that catch anomalies before stakeholders see them. Surface freshness and lineage directly on dashboards so executives never have to ask “is this current?”
Unusual spikes or drops get flagged automatically with context attached. Every calculation stays visible and documented. When numbers change, the explanation is already there.
What you get: time series dashboards that executives actually rely on for decisions, not just for decoration.
Summary
Executive trust in time series data comes from process and governance, not from clever SQL.
Your queries might be technically flawless, but if numbers shift without explanation, if different dashboards show conflicting figures, if nobody can answer “when was this last updated?”, trust erodes quickly.
Where to start: Pick one business-critical time series metric, revenue, active users, pipeline value. Define it centrally. Add validation tests. Track when data was last refreshed. Put that context on the dashboard. Then repeat for the next metric.
Executives don’t need perfect data. They need data that’s consistent, explainable, and verifiable. Deliver that, and they’ll use what you build.
Ready to build time series dashboards executives actually trust?
Book a 1:1 session with ClicData’s product team to see governed analytics in action, or start a free trial to explore on your own.