How to ship a reliable, self-refreshing dashboard that keeps itself current
If you are an end user of data and reports that come from dashboards, likely you don’t just want a dashboard as a one-off. You want one that keeps itself up to date when it is needed. The data refreshes as expected, charts remain stable after the dashboard is built, and if something does break, you’ll get an alert before leadership points out a data issue.
The good news is this can be avoided thanks to following best practices and using features from the ClicData platform with the repeatable steps mentioned throughout this article.
The following sections will be covered:
- Fundamentals that make auto-refreshing dashboards sustainable over time.
- A walkthrough into some of the features of ClicData (using dummy data) such as connecting to sources, transforming the data, scheduling the pipeline, providing alerts and visualising the data.
Part 1 – Concepts & Best Practices for Self‑Refreshing Dashboards
This section contains a guide for best practices when it comes to ensuring data used within dashboards stay up to date. Dashboards should behave like a reliable in demand product as opposed to a one‑off report.
The goal is simple: keeping the data up-to-date & correct so it can be useful every time its needed with the least amount of overhead & effort to keep it that way.
1) Decide what “auto‑refresh” really means
Not every use case needs real time data. Asking the following questions will help define what auto-refresh really means so the correct approach can be applied.
- Update cadence: does the dashboard need the latest data up to the second or is a daily/weekly cadence enough to solve the requirements? This can be tied back to how the dashboard is to be used? If it’s for measuring performance over a time period such as monthly, weekly or daily then a daily batch job will suffice as opposed to streaming real time data..
- Refresh strategy: full reloads vs. incremental loads (only new/changed rows). Incremental is faster, cheaper and friendlier to source systems. Full reloads are slower and more expensive but can also be more complete.
2) Model for durability, instead of just for today
Use layers so each step remains simple:
- Raw: land data as it is from sources.
- Transform: apply all changes from the source in as minimal layers as possible eg, clean types, fix nulls, normalize values, joins. This includes pre‑aggregations especially if the dashboard is slow.
- Presentation: the final cleaned dataset that is denormalized and ready for dashboards to visualize.
Maintain patterns for a more robust build that can handle various potential scenarios by:
- Indexing: Choose a primary key you can rely on (or make one). When keys are composite, enforce uniqueness (order_id + line_number).
- Slowly Changing Dimensions: If sources alter historical data (common in many systems), make use of created_ts/updated_ts and a soft‑delete flag so incremental loads stay correct.
- Pre‑aggregations: Grouping daily by certain attributes (sales_by_day_region_category) drastically reduces the query cost and variability.
3) Make your refresh pipeline idempotent
An auto‑refreshing data flow that can’t be safely re‑run without further downstream issues is not idempotent. Since auto-refreshes will not always be reliable, idempotency can be achieved by:
- Deterministic inputs: Fetch new/changed data by using an updated_since field or add a 24–48h overlap buffer for late arriving data.
- Merges: Upsert on unique keys rather than append‑only. If a step fails mid‑run, re‑running should not duplicate rows.
- Atomic outputs: Write results to a temp table, then overwrite on success so downstream users won’t see a half‑built state.
- Retries: If sources are APIs, then applying retry logic minimizes data loss.
4) Quality checks & alerts
Emphasize data quality upfront:
- Volume based checks: Are row counts always expected to be above 0? Compare rolling averages to catch partial feeds.
- Schema checks: Are column names and field types expected to change? What happens if a new column appears in the data source?
- Business rules: e.g. conversion rate should never be negative, revenue shouldn’t drop to 0% without a reason.
- Actionable alerts: Route to the right channel with context: dataset, step, run id, last successful time, and a link to investigate.
5) Documentation
- The mini pipeline creating data for the dashboard transforms descriptively.
- Consider the use of a README.md file that covers deeper knowledge such as data lineage and parameters.
6) Consider performance & cost
- Favor incremental/delta loads instead of full refreshes where possible. Incremental or delta loads means only the updated data is loaded in instead of the entire dataset.
- Avoid high refresh frequency if its not necessary.
- Limit join explosions and wide text columns in the presentation layer.
- Monitor refresh history and failure rates.
Part 2 – Walkthrough into ClicData features
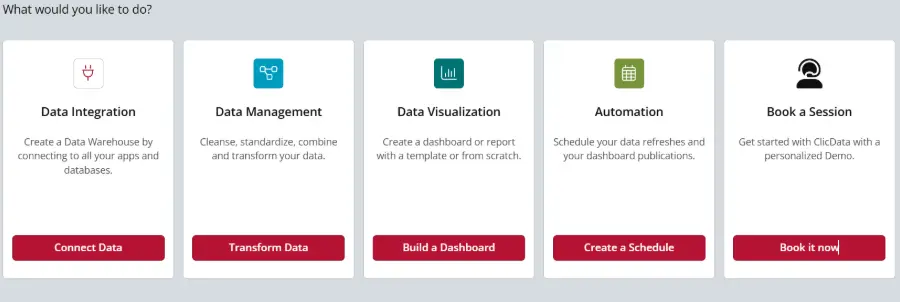
Let’s now walk through some of ClicData’s features by building a mini data pipeline that is visualized in a dashboard on the platform and self-refreshes.
The dummy data consists of:
- orders: order details such as when the order was, the products ordered, quantity and price.
- customers: details of the customer including their region and segment/type.
- products: product information such as category and brand.
- marketing_spend: spend_date, channel, spend
Step 1: Connect data sources
- Add each source as a dataset. Many sources and connectors are available (e.g., web service/API, spreadsheets, files, OData/DB). In this example the following spreadsheets were added: orders.csv, customers,csv, products.csv & marketing.csv .
Tips
- Normalize data types (dates as dates, numbers as numbers) so details are more clear and adopted from downstream steps.
- Each connector sources has its own implications to consider eg. for APIs, capture required parameters (date ranges, pagination). For sheets, lock the tab structure.
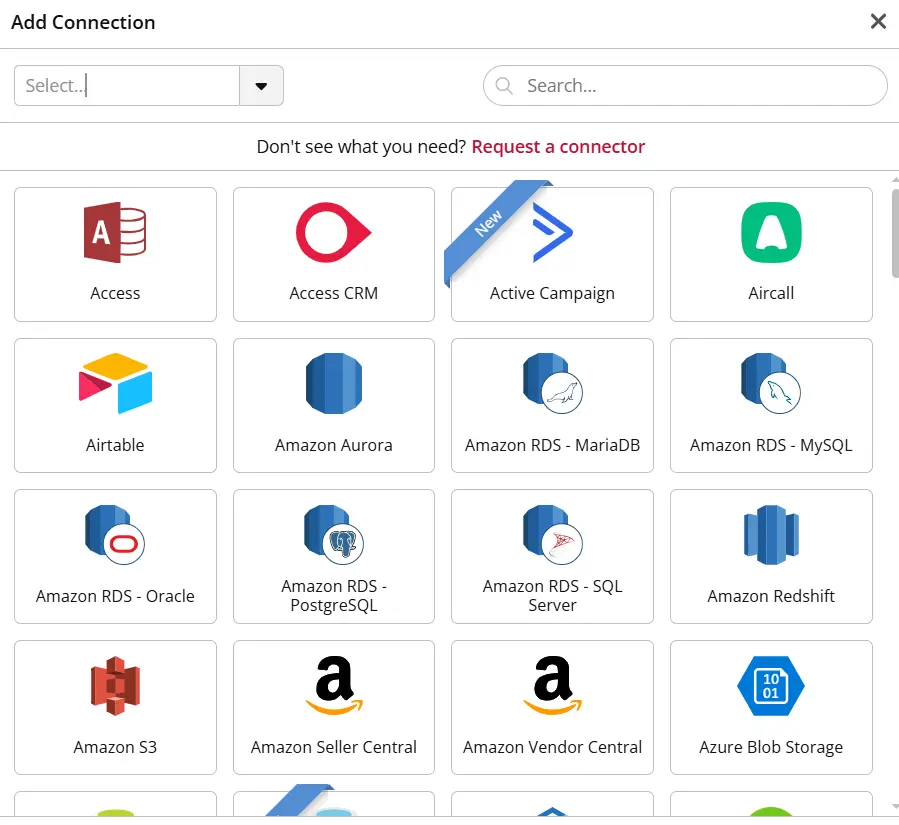
Many 3rd party connections are natively available within ClicData
Step 2: Build a Data Flow for transformations
Create a data flow with four inputs: orders, customers, products, marketing.
Then the following steps may typically be used in creating the mini data pipeline for the dashboard:
- Clean data types: cast types, trim text, standardize statuses.
- Enrich: join relevant datasets together.
- Aggregate: compute daily metrics such as revenue & orders.
- Output: define the final tables.
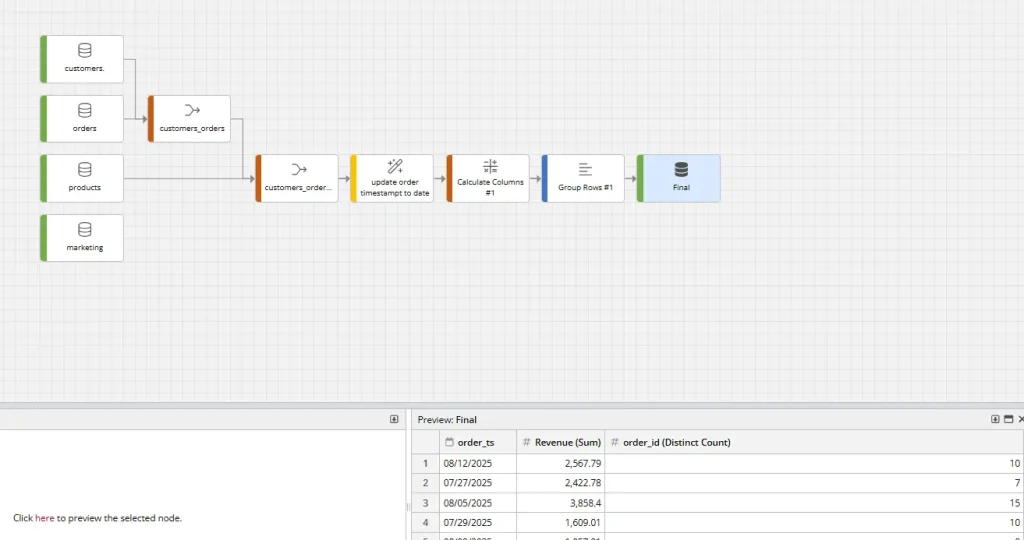
Data flows in ClicData are great to visualize the movement of data to the dashboard
Step 3: Orchestrate with a morning schedule
Create a single schedule with ordered tasks that re-run the data flow. This includes:
- Refreshing the data sources with incremental updates
- Re-run the subsequent steps which formats and joins the sources and outputs the results into the final table.
- Add notifications (email/Slack/webhook) and a simple retry policy to confirm the status of the data refresh task.
Orchestration within ClicData is seamless
Step 4: Add production‑grade alerts
Define alert rules that inspect the metrics after the Data Flow runs, some examples include:
- Revenue dip: If Revenue drops by a certain percentage.
- Conversion anomaly: if conversion is outside a tolerance threshold.
- Zero data: if rowcount from the flow is 0.
Alerts get routed to the relevant people and channels that provide support on the dashboard such as a DataOps team.
Step 5: Complete the Dashboard
ClicData has the ability to provide clean visualizations of data. Other features include:
- User/Team parameters: assigning a default region/team at the account level so each viewer can see the data relevant to them when they open the dashboard.
- Dashboard parameters: expose an interactive filter for ad‑hoc exploration.
- Data freshness: can also be displayed so the user knows the latest date the data is extracted for.
Visualizations in ClicData
Step 6: Monitor and tune
- Check Schedule History each week and look for growing durations or intermittent failures.
- Refresh time should also be monitored. If it starts to increase then strategies to mange it include reducing the look‑back window, adding indexes/keys to dedupe faster or pre‑aggregating earlier.
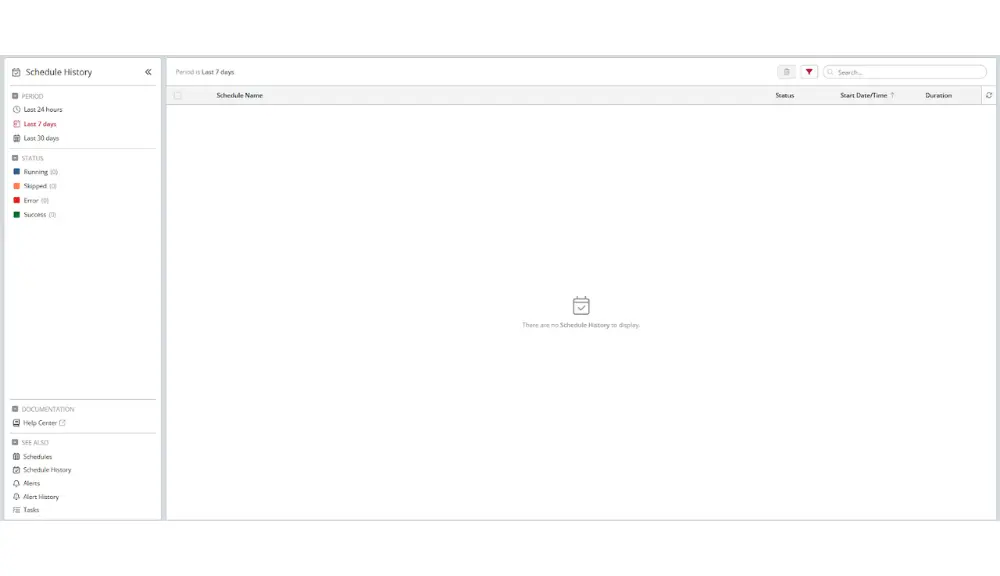
Scheduling in ClicData can be achieved with a few clicks so pipelines automatically re-run
Final Thoughts
Auto-refreshing dashboards shouldn’t feel like a luxury, they should be the norm. When you design layers properly, schedule pipelines, and build in quality checks from the start, your dashboards stop being fragile reports and become reliable analytics products you can trust every day.
The best part? You don’t have to piece this together on your own. ClicData’s automation features make scheduling, refreshing, and monitoring seamless so you spend less time babysitting dashboards and more time acting on insights.
Why not give it a try and see how much time you can save with automation built in?