Plans & PricingSignup for Free

Keep it Clean! ClicData Feature Focus: Standardize & Normalize.

By Telmo Silva on January 15, 2016

Sometimes, the simplest features make the biggest impact!

Check it out: our new Standardize and Normalize widgets help tackle some of the most frustrating problems in BI!

As we all know, getting your data prepped for use is often the most laborious step of the Business Intelligence exercise. Data is spread out across a number of sources and is anything but consistent, while your job is to bring it together in a unified, usable whole.

Connect data from (almost) anywhere

We’ve tackled the first problem and already allows you to connect to the data from most platform or location with the ClicData connectors and our Data Loader.

Standardize: Use consistent field names

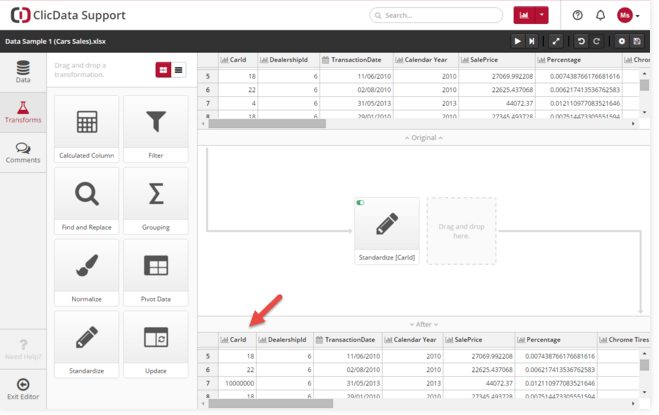
As for the second problem? That’s where our new Standardize widget comes in to help you clean up your data so that fields that contain different spellings for the same content can play together.

Let’s say you have a product name that you find has more than one spelling across different databases and applications. Use the Standardize widget! Simply drag and drop it to the field in question and let the magic happen.

standardize1
It’s easy! Use Find and Replace and then double-check that the change is exactly what you intended.

Want to know more about this feature? You can visit our documentation.

Normalize: Clean up empty fields

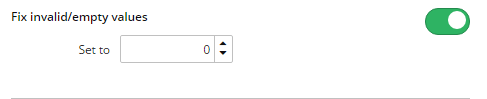
Here is another time waster that ClicData easily conquers for you: rectifying empty fields that can mess up your calculations.

Again, simply drag and drop the Normalize widget and determine the value that you want the empty field to display.

standardize2

Want to know more about this feature? You can visit our documentation.

Use our new Standardize and Normalize data widgets to clean up your data so that your analyses and metrics are more accurate and so you have more time for more important things.

Table of Contents

Share this Blog

Other Blogs

A Chart Chooser for BI Teams: Stop Guessing, Start Deciding

The wrong chart doesn't just look bad, it changes what people believe the data says. When a trend appears flat on a pie chart or a comparison gets buried in…

Why AI Fails without Data Engineering

Industry reports suggest that as many as 80% of AI projects fail to deliver anticipated value. This failure rarely stems from the AI models themselves, but from fundamental issues such…

Stop KPI Drift: SQL Reporting That Stays Consistent Over Time

Executives don't distrust your time series data because the SQL is wrong. The SQL is usually fine. The problem is that last quarter's numbers changed between the July board meeting…
All articles
We use cookies.
We use necessary cookies to make our site work. We'd also like to use optional cookies which help us improve our the site as well as for statistical analytic and advertising purposes. We won't set these optional cookies on your device if you do not consent to them. To learn more, please view our cookie notice.

If you decline, your information won't be tracked when you visit this website. A single cookie will be used in your browser to remember, your preference not to be tracked.
Essential Cookies
Required for website functionality such as our sales chat, forms, and navigation. 
Functional & Analytics Cookies
Helps us understand where our visitors are coming from by collecting anonymous usage data.
Advertising & Tracking Cookies
Used to deliver relevant ads and measure advertising performance across platforms like Google, Facebook, and LinkedIn.
Reject AllAccept