
Plans & PricingSignup for FreeGet a demo

Ice Cream & Dashboards

Hélène Claryon June 26, 2015
Last updated on July 22, 2025

To open the summer season, we have decided to look into the ice cream eating habits mmmmmh !

Make sure to read this fun dashboard blog as you are close to an ice cream supply facility especially if the weather is hot wherever you are ;-)

Our little survey here is not international, as it turned out the American are quite the ice cream champions when it comes to having data showing how much they love this nice sugary, milky dessert or snacks that can be enjoyed anytime of the day.

So here is your first statistic to confirm my saying: 90% of the Americans eat ice cream on a regular basis!

Next fun fact….the flavor! Despite the highly inventive funny colored flavor such as the blue smurf ice cream, the classics come first in the flavor contest with chocolate and vanilla been the 2 most favorites preferably with hot fudge topping for a little over 1 every 2 ice cream fans.

Last but not least ice cream feature… what should be holding the ice cream goodness: the cup seems to be the preferred way to consume the ice cream for both men and women. While women also enjoy it on cones, men like Sundaes.
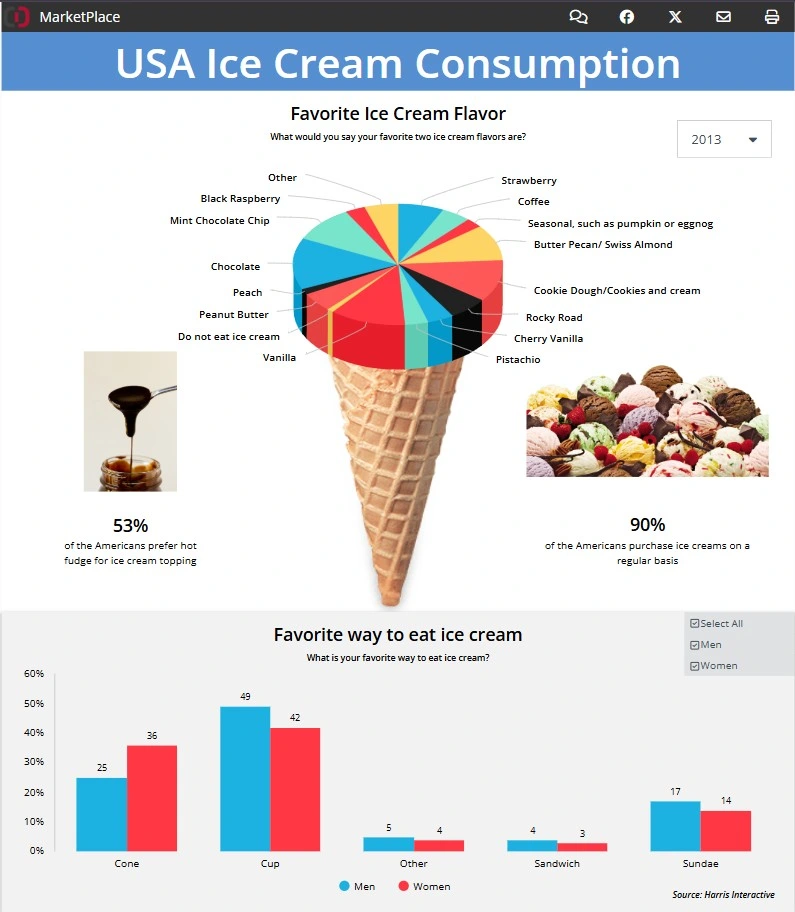
USA ice cream consumption statistics pie chart.
Click on the picture to access the full infographic

Happy summer and happy dashboarding!

Table of Contents

Share this Blog

Other Blogs

AI Analytics for SaaS Platforms: How to Add Intelligence Without Building It From Scratch

Give a competent engineering team a week and they'll have something working. A GPT endpoint wired up, a charting library on the front end, a handful of SQL queries hitting…

From BI to AI Analytics: What the Transition Actually Looks Like in Practice

In most mid-market companies, the BI half of the picture is the part that's settled: the dashboards refresh overnight, the Monday reports land in inboxes, and there's a tidy stack…

ABC Analysis in Inventory Management: How to Classify Your SKUs and Manage by Impact

You're managing 400 SKUs. You treat every product the same, same reorder triggers, same attention, same safety stock logic. Then one of your top-10 revenue products runs out on a…
All articles
We use cookies.
We use necessary cookies to make our site work. We'd also like to use optional cookies which help us improve our the site as well as for statistical analytic and advertising purposes. We won't set these optional cookies on your device if you do not consent to them. To learn more, please view our cookie notice.

If you decline, your information won't be tracked when you visit this website. A single cookie will be used in your browser to remember, your preference not to be tracked.
Essential Cookies
Required for website functionality such as our sales chat, forms, and navigation. 
Functional & Analytics Cookies
Helps us understand where our visitors are coming from by collecting anonymous usage data.
Advertising & Tracking Cookies
Used to deliver relevant ads and measure advertising performance across platforms like Google, Facebook, and LinkedIn.
Reject AllAccept