Plans & PricingSignup for FreeGet a demo

ClicData Feature Focus: TimeStamp

Telmo Silvaon October 30, 2015
Last updated on May 14, 2025

Let’s talk about our awesome TimeStamp feature.

To understand how it works, first think about our Data History tool. With Data History, every time you upload new data from a data source, ClicData archives the previous version. This can be a lifesaver if you lose data or if it gets corrupted somehow. With Data History, you can easily return to a previous working version and be back in business in no time.

Now imagine using this feature directly within a dashboard! That’s what TimeStamp is all about.

With TimeStamp, you can compare budgetary or performance events as they occur over time with your dashboard that you wouldn’t be able to see using a standard chart. For example, you can line up variables within ‘Before’ and ‘After’ scenarios and compare their outcomes, positions, and more. It’s an extraordinarily useful tool to compare strategies and forecasts with different factors at play.

Here’s how to get TimeStamp working for you in two easy steps:

1) First, you’ll enable the TimeStamp feature when you import your data into ClicData. During the third step, when your data is being verified, move the Timestamp switch ON in the bottom left of your screen. Once you do, a new column will automatically be added to your data source.  
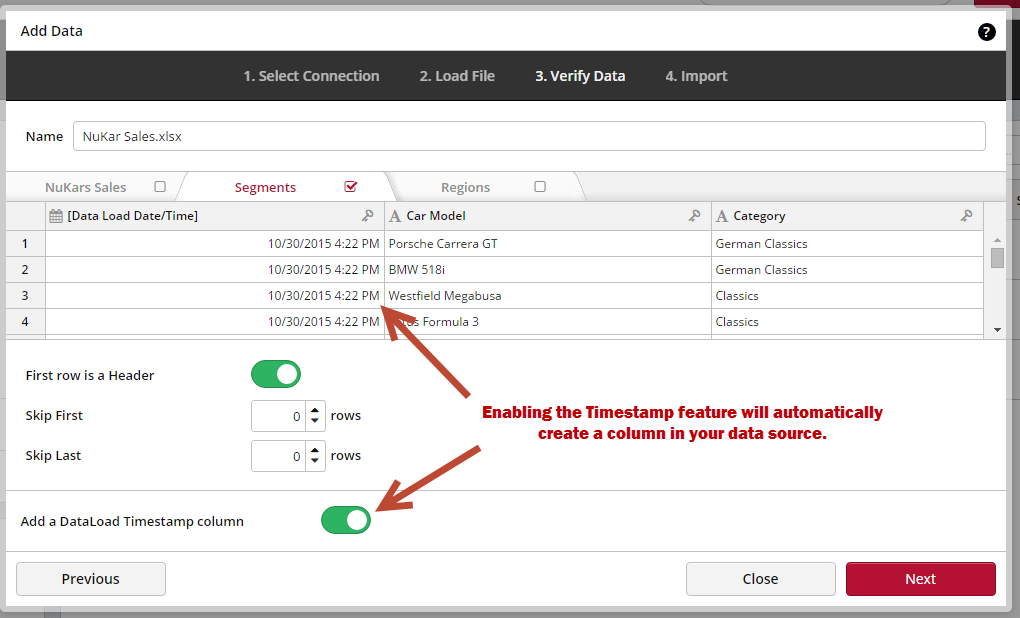
TimeStamp clicData

2) Once TimeStamp is enabled, you can go to the Dashboard Creator, and set a filter to display only the time/date of the data you want.

If you have never set up a filter in ClicData, here is how to do it.

And there you are, if you want further assistance with TimeStamp or any other feature in ClicData, let us know!

Happy Dashboarding!

Table of Contents

Share this Blog

Other Blogs

AI Analytics for SaaS Platforms: How to Add Intelligence Without Building It From Scratch

Give a competent engineering team a week and they'll have something working. A GPT endpoint wired up, a charting library on the front end, a handful of SQL queries hitting…

From BI to AI Analytics: What the Transition Actually Looks Like in Practice

In most mid-market companies, the BI half of the picture is the part that's settled: the dashboards refresh overnight, the Monday reports land in inboxes, and there's a tidy stack…

ABC Analysis in Inventory Management: How to Classify Your SKUs and Manage by Impact

You're managing 400 SKUs. You treat every product the same, same reorder triggers, same attention, same safety stock logic. Then one of your top-10 revenue products runs out on a…
All articles
We use cookies.
We use necessary cookies to make our site work. We'd also like to use optional cookies which help us improve our the site as well as for statistical analytic and advertising purposes. We won't set these optional cookies on your device if you do not consent to them. To learn more, please view our cookie notice.

If you decline, your information won't be tracked when you visit this website. A single cookie will be used in your browser to remember, your preference not to be tracked.
Essential Cookies
Required for website functionality such as our sales chat, forms, and navigation. 
Functional & Analytics Cookies
Helps us understand where our visitors are coming from by collecting anonymous usage data.
Advertising & Tracking Cookies
Used to deliver relevant ads and measure advertising performance across platforms like Google, Facebook, and LinkedIn.
Reject AllAccept