In the last three years, the number of job postings for data scientists, analysts, Python and R experts has increased greatly. Much like the Gold Rush, everyone is migrating to these highly prized and challenging careers to explore data, big and small, and produce analytical summaries and descriptions of the meaning and impact it may have to their organization or even humankind.
We have all seen the deductions, trends, predictive and what-if analysis that many of these brilliant people can perform using everything from Excel to the most sophisticated piece of software and hardware.
But, much like the gold rush, all good things come to an end. The amount of data, its complexity and the edge cases around data sets may be too much for one person, regardless of how gifted they are, to even attempt to dig into the data. In an era where computers and robots are replacing manual labor, they are also replacing mental labor.
If the name of the game is speed, then humans are too slow. If the complexity and volume is beyond what simple, single-threaded flow a human can process, then humans are simply not up to the task. Much like the industrial revolution, we need to learn new skills. Humans will resort to pushing the power button to restart the machine in case it gets clogged or ensuring there is enough coal in the steam engine to keep going.
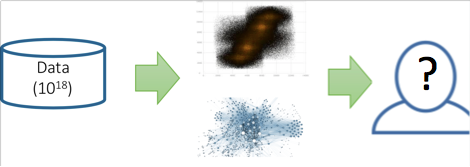
It is not a pessimistic view; however, it is approaching reality. Currently, we are able to analyze millions (10^6) and billions (10^9) of rows, but we are approaching data sets with quadrillion (10^15) and quintillion (10^18) rows – data sets of disparate schema and format (free formatted text, json/no-sql, binary). Are we that arrogant to think we are up to the task?
In today’s world, a data analyst will be confronted with standardized data sets, cleansed that with the proper knowledge and tools that can be visualized and then dissected for information.
But with a much more dense and wider variety of data, the task is no longer as simple.
The capability to even write algorithms to identify patterns, trends or outliers becomes much more difficult, and with the iteration time to validate assumptions, the human way becomes prohibitive. It is here that humans need to pivot and develop machines and algorithms not to directly analyze the data, but to create other algorithms responsible to analyze the data.
Artificial intelligence and robots are coming! Well maybe not exactly, but there definitely have been amazing advances in machine learning. Just look at Microsoft Azure’s new features that include a series of Cognitive Services, Machine Learning Services and more. These are all bricks in building machine learning programs that can handle the massive amount of data and reduce it to a size that we can grasp.
But why stop there? Why have the machines simply filtering the data down to a more manageable size? Why not just teach the machine, that in turn teaches other machines, to simply give us analytical descriptive summaries of our data? Why does that also require a human being behind this step when we are so susceptible to visual and personal biases when looking at data in its various formats?
A machine will look at a data from a chart and describe it without the need for the visual cues. It doesn’t look at color, shape or size of lines or how they “appear” to drastically rise or fall. Instead, it looks at statistical variances, trends and comparisons – pure mathematical assessments which can be enriched with qualitative data in a way that no human can. A machine can consult weather databases, Wikipedia, stock markets, news feeds and much more in milliseconds to enrich any timeline event based data. They can consult historical data from disparate data sets in seconds to assess hypothesis. And they can do these tasks for millions of data rows at a time in parallel.
The future will be a short email, Slack or potentially an automated voice call or a video message with a one minute overview of the most complex analysis in easy to understand words, well illustrated so that you can immediately understand whats going on with your business, your project or your social network.