Most dashboards don’t break on the screen — they break before they ever get there.
A batch slips, a CSV header changes, a task reports success after loading zero rows, and suddenly yesterday’s revenue is flat, and nobody trusts the numbers.
What follows is a practical playbook for building reliable, scalable, auditable BI pipelines: what to set up, why it matters, and how to keep it healthy next quarter.
Let’s dive in!
Why reliable data pipelines matter
Business intelligence only works if clean data arrives on time in a shape people can query.
Reliability isn’t a “nice to have.” It’s the foundation for trust.
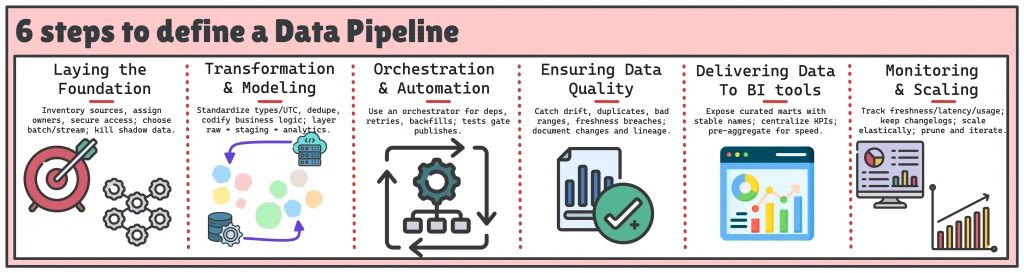
To get there, you need more than just moving data from A to B. You need a structured approach that covers everything from source inventory to monitoring. That’s where the 6 steps to define a reliable data pipeline come in:
- Laying the Foundation: Clarify sources, owners, and access.
- Transformation & Modeling: Standardize, clean, and codify business rules.
- Orchestration & Automation: Schedule, retry, and test systematically.
- Ensuring Data Quality: Detect drift, duplicates, and breaches early.
- Delivering Data to BI tools: Expose curated, stable, easy-to-use marts.
- Monitoring & Scaling: Track freshness, usage, and evolve pipelines over time.
These steps work together to ensure your pipeline stays reliable. Let’s break them down to see how.
Laying the Foundation: Data Sources and Ingestion
Every pipeline lives or dies at ingestion. If this layer is shaky (unclear sources, ad-hoc files, missing access), everything downstream inherits the mess.
Start here, build strong.
#1 Identify and prioritize data sources
Map what actually feeds BI. Don’t assume, inventory it.
- Systems: OLTP databases, data warehouses/lakes, event logs
- External: partner SFTP/FTPs, REST/GraphQL APIs, webhooks, CDC streams
- Local/SaaS: spreadsheets, CSV exports, CRM/ERP/SaaS exports
Now prioritize by how the business runs, not by what’s easiest to connect:
- Business impact: Which decisions would stall without this data?
- Freshness need: Real-time, hourly, daily, monthly?
- Quality & stability: Known schema? frequent breaks?
- Ownership: Clear domain owner and on-call?
- Risk: PII/PHI/financial data; contractual limits
A simple scoring grid keeps you honest:

Pro Tip. Watch out for unofficial data. Things like private Google Sheets, ad-hoc CSVs, or side exports sneak into reports. Find them early and either add them to a governed pipeline (with an owner) or remove them before they show up in your KPIs.
If you are pulling from SaaS or APIs, I encourage you to use this API pipeline playbook to harden ingestion (pagination, schema changes, retries).
#2 Establish access, security, and permissions
Get access right once; stop firefighting later.
- Least privilege + RBAC: service accounts, role-scoped policies, no shared creds
- Secrets & rotation: managed secrets (Vault/KMS), rotation schedule, break-glass path
- Compliance: note GDPR/HIPAA/SOX touchpoints, where PII/PHI lives, masking policy
- Audit: log who accessed what/when; keep evidence for reviews
- Ownership: name a data owner and an operational contact per source
Source registry:
sources:
  - name: finance_ledger
    system_of_record: true
    owner: finance@company.com
    access: read_only_service_account
    pii_fields: ["customer_name","iban"]
    retention: 7y
    refresh_cadence: daily_06_00
    sla_minutes: 120
    ingestion_mode: incremental_watermark(updated_at)
  - name: salesforce_api
    system_of_record: true
    owner: sales_ops@company.com
    access: oauth_app_reg
    pii_fields: ["email"]
    retention: 3y
    refresh_cadence: hourly
    sla_minutes: 30
    ingestion_mode: cdc_stream
#3 Choose the right ingestion approach
Pick the approach that matches latency, volume, and how your data changes; not the tool you happen to like.
Batch is the workhorse for BI. You move data on a schedule (hourly, nightly) and pay less in complexity and cost. It’s perfect when nobody needs minute-level freshness: finance ledgers, daily order snapshots, month-end HR tables. You get predictability, simple retries, and easy backfills.
Streaming is for moments, not mornings. If your dashboards or alerts must react within minutes, product telemetry, user journeys, fraud signals, stream events as they happen. Prefer change data capture (CDC) or webhooks to constant polling: you’ll capture inserts/updates/deletes with lower lag and fewer wasted calls. Trade-off: more operational care (ordering, exactly-once semantics, late events).
Once you’ve chosen batch or stream, decide how you load:
- Incremental loads move only what changed. Use a watermark (updated_at) or CDC feed, then upsert into staging/marts. This scales, keeps history when you need it (Type-2 dimensions), and avoids reprocessing millions of unchanged rows.
- Full refresh rewrites a table end-to-end. Keep it for small dimensions, initial loads, or explicit backfills and schema resets—because it’s expensive, can blow caches, and may invalidate downstream extracts.
Rule of thumb: If no consumer can name a decision that needs data <5 minutes old, stay batch. If a table has >1M rows and changes daily, stay incremental. If the table is tiny or you’re resetting logic, a full refresh is fine.
In case you need a refresher on how ETLs work, just go check this ETL basics guide, which covers extract/transform/load with examples you can reuse.
Transformation and modeling
Ingestion moves bytes. Transformation turns them into answers. This is where BI pipelines start earning their keep.
#4 Standardize and clean data early
Decide your rules once, apply them at the edges.
- Store timestamps in UTC; carry the original timezone in a column if you need it later.
- Normalize types (dates as dates, booleans as booleans). Stop treating everything as text.
- Make currency explicit (amount, currency_code) and join to an FX table instead of assuming USD or euros.
- Handle missing values on purpose: NULL for unknown, sentinel values only when documented.
- Deduplicate on a stable business key before downstream joins.
Pro Tip: Trim stray whitespace, standardize case for codes, and collapse near-duplicates before they inflate metrics.
#5 Apply business logic in a transparent way
If a KPI matters, its logic should live in the repo, not in a hidden BI calc.
- Put transformations in versioned SQL/dbt models.
- Keep models short and named for what they do (stg_orders, fct_orders, dim_customer).
- Document the rule next to the code; add tests.
Design guardrail: one model, one responsibility. If a query explains three different business rules, split it.
#6 Build a layered architecture (raw → staging → analytics)
Keep layers simple and predictable:
- Raw: an immutable copy of the source. No fixes, no opinions.
- Staging: standardized, deduped, type-safe.
- Analytics: facts/dimensions/marts modeled for BI.
Keeping layers separate makes fixes easy: if a value is correct in raw but wrong in staging, you likely have a casting/type issue in staging. This clear split also makes audits smoother.
#7 Optimize for performance and scale
Performance is architecture plus a few disciplined habits.
- Prune early: filter rows/columns in staging so the heavy joins process less data.
- Partition/cluster large tables on common predicates (date, tenant, region).
- Use materialized views or incremental models for expensive transforms.
- Avoid SELECT * in production paths; it defeats pruning and breaks with schema drift.
- Benchmark with production-sized inputs and read the plan (EXPLAIN). Fix the slowest 10%.
Orchestration and automation
Automation is what turns a folder of SQL files into a system. It schedules the work, watches the dependencies, retries the flaky bits, and refuses to publish bad data.
#8 Use a workflow orchestrator (and design for operations)
Airflow, Prefect, Dagster, dbt Cloud, pick the one that matches your stack and team skills. Whatever you choose, aim for the same operational contract:
- Clear dependencies. Each step declares what it needs and what it produces. No hidden side effects.
- Calendars and time zones. Month-end, holidays, and DST shifts are real; make schedules time-zone aware and document cutoffs.
- Retries with backoff + idempotency. A retried task must not double-load data. Writes go to temp/staging tables, then swap in a single atomic step.
- Parameterization. The same flow runs in dev/stage/prod with environment variables, no copy-paste DAGs.
- Backfills. First-class support for catch-up windows (event-time vs processing-time), with resource limits so a backfill doesn’t starve daily loads.
Pro Tip: One domain per DAG is easier to reason about. Keep tasks small and side-effect-free until the final publish step.
To further understand orchestration, you can see how to design SLA-driven schedules with retries, backfills, and clear cutoffs in the following guide.
#9 Monitor dependencies and failures (alerts that humans can act on)
Don’t alert on everything; alert on missed expectations:
- Freshness SLA breached (“fct_orders > 120 min old”).
- Late start (scheduler backlog) or run overrun (still running after X).
- Zero-row load where you expected data (compare to a rolling 7-day baseline).
- Test failures that block publish.
Each alert should include:
- What broke: dataset/model, env, DAG + run ID, task name.
- Why: short error snippet + link to logs
- What to do: one runbook step (e.g., “Re-run from stage”, “open incident after 3 fails”)
#10 Automate tests and validation (gate bad data, don’t just report it)
Testing isn’t a once-a-day query. It’s a set of small checks that run with the pipeline and can stop a bad publish.
- Schema tests: required columns, data types, uniqueness, valid enums.
- Data tests: row counts within expected bounds; NULL thresholds; referential integrity.
- Logic tests: enforce business rules—for example, net_revenue >= 0 and customer_count > 0.
- Contract tests (upstream producers): fail fast if a source changes a column name/type.
Make tests blocking for critical models, warning for exploratory ones. Two more habits that save weekends:
- Canary runs on a tiny date range before the full window; promote only if tests pass.
- Quarantine on fail: write outputs to a scratch schema; only swap to analytics after green tests.
Automation doesn’t remove humans from the loop, it makes the loop smaller, clearer, and faster to close.
Ensuring data quality and reliability
Good BI isn’t just fast, it’s trustworthy. Build small guardrails where problems actually happen, not just a big test at the end.
#11 Implement data quality checks (where risk lives)
Spread lightweight checks across the flow so failures are cheap to catch:
- At landing/source: detect schema drift, column type changes, and suspicious volume swings (a 10× drop/spike without an incident note).
- In staging: enforce keys and types, suppress duplicates, handle NULLs intentionally, and keep values in sane ranges.
- In marts: protect business rules (e.g., net_revenue ≥ 0), referential integrity (facts → dims), and freshness SLAs.
A few patterns that consistently pay off:
Staging PK uniqueness
Finds duplicate order_id values in stg_orders. This should return zero rows; any hit means bad keys or re-ingestion, which will inflate joins and metrics.
-- Staging: supposed primary key must be unique (should return zero rows)
SELECT order_id
FROM stg_orders
GROUP BY order_id
HAVING COUNT(*) > 1;
Volume guard (zero-row / big-drop alert)
Compares today’s row count to the 7-day median. If today < 60% of normal, raise an error, catching “task succeeded but loaded 0” or silent upstream filters/schema changes.
-- Volume guard: flag "success with 0 rows" and big drops vs a 7-day baseline
WITH today AS (
  SELECT COUNT(*) cnt
  FROM stg_orders
  WHERE order_date = CURRENT_DATE
),
hist AS (
  SELECT PERCENTILE_CONT(0.5) WITHIN GROUP (ORDER BY day_cnt) p50
  FROM (
    SELECT COUNT(*) day_cnt
    FROM stg_orders
    WHERE order_date BETWEEN CURRENT_DATE - INTERVAL '7 day' AND CURRENT_DATE - INTERVAL '1 day'
    GROUP BY order_date
  ) x
)
SELECT CASE WHEN today.cnt < 0.6 * hist.p50
            THEN RAISE_ERROR('orders too low vs 7-day median') END
FROM today,hist;
Mart invariant (business rule must hold)
Ensures no record violates a core rule, here, net_revenue < 0. This query should also return zero rows; any result blocks published before bad numbers hit dashboards.
-- Mart invariant: business rule must hold (zero rows expected)
SELECT 1
FROM fct_orders
WHERE net_revenue < 0
LIMIT 1;
Two more habits that save weekends:
- Block bad publishes. Tests should gate the swap from scratch to analytics.
- Test early. Catching a bad watermark in staging is minutes; catching it after three joins is hours.
#12 Version and document transformations (so changes are explainable)
If a KPI moves and you can’t show when the logic changed, you’ll lose trust, even if the math is right.
- Keep every model and macro in Git. Short, reviewable PRs beat giant ones.
- Auto-generate docs (dbt docs or your catalog) and publish them where analysts work.
- Write why in the PR: intent, impacted models, backfill plan, rollback plan.
- Tag releases that alter metric definitions; keep a simple CHANGELOG.md for marts.
- Pin tool versions (dbt/clients) so runs are reproducible months later.
#13 Track lineage and dependencies (so you fix the right thing, fast)
When a model fails or a number changes, two questions matter: who’s affected and what broke upstream.
- Maintain end-to-end lineage: raw → staging → marts → dashboards (column-level where possible).
- Use a catalog/lineage tool (OpenLineage, DataHub, Atlan, dbt docs) to auto-capture producers/consumers.
- Tie lineage to ownership: each node lists an owner and on-call route.
- Run impact checks before merging breaking changes: list downstream models/dashboards and schedule the rollout.
How it plays out in practice:
- If a table fails → lineage shows which marts and dashboards are at risk → notify those teams first and pause publishing.
- Planned schema change → lineage identifies affected models → coordinate a backfill window and tests.
- Incident page links to the lineage graph and last green tag → you know where to roll back and who to ping.
Quality isn’t a final checkbox. It’s a set of small, boring guardrails that make the interesting work, analysis, and decisions possible, day after day.
Delivering data to BI tools
The last mile is where trust is won or lost. Model with the end user in mind and ship surfaces that are hard to misuse.
#14 Model for the end user
Give analysts a clean, predictable shape.
- Curated schemas only. Expose analytics (facts/dims/marts). Keep raw and staging hidden from ad-hoc users.
- Use a stable, consistent naming convention: Define clear patterns for fact tables, dimensions, keys, and timestamps, and standardize field names to business-friendly terms instead of system jargon.
- Denormalize for usability. Star schemas and wide marts beat five-join spaghetti for 90% of dashboard work.
- Keys that join. One surrogate key per dimension; make join columns the same type/format on both sides.
- Access boundaries. Apply row-level/column-level policies (e.g., region scoping, masking PII) before the BI tool.
Pro Tip: Resist exposing the whole warehouse. Curated surfaces prevent mis-joins, double counting, and “why doesn’t my number match?” threads.
#15 Align with business KPIs
One definition, everywhere.
- Centralize metrics. Put the business math in a semantic layer / metric store (dbt Semantic Layer, LookML, Cube, MetricFlow, etc.).
- Name the owner. Each KPI has a human owner, a definition, and tests. Changes happen via PRs, not ad-hoc BI calcs.
Decide the grain.
Specify default time grains, calendars (ISO vs fiscal), currency handling, and filters (e.g., exclude test orders).
A good way to do so is to generate specifications for metrics.
Metric spec (illustrative)
metrics:
  - name: total_revenue
    label: "Total Revenue"
    type: sum
    sql: net_revenue
    model: ref('fct_orders')
    time_grains: [day, week, month]
    filters:
      - name: valid_orders
        condition: "order_status = 'completed'"
    owner: finance@company.com

  - name: revenue_per_order
    label: "Revenue / Order"
    type: derived
    expr: "total_revenue / orders"
    depends_on: [total_revenue, orders]
Design rule: ban parallel “revenue” definitions. If a dashboard needs a twist, encode it as a filtered metric, not a copy-paste formula.
#16 Optimize for BI tool performance
Fast dashboards get read. Slow ones get screenshots.
- Pre-aggregate hot paths. Daily/weekly tables for the top queries; rollups for “last-N days.” Materialize where it saves seconds.
- Use extracts/caches wisely. If live queries are heavy or the warehouse is busy, serve extracts or cached summaries and refresh on a cadence.
- Filter first. Ship dashboards with sensible defaults (e.g., “last 90 days, top regions”) rather than scanning all history.
- Make queries sargable. Filter on partitioned/clustered columns; avoid wrapping those columns in functions in WHERE clauses.
- Trim payloads. Select needed columns only; avoid high-cardinality cross-filters that explode joins.
- Push compute earlier. Precompute expensive calcs (percentiles, windowed KPIs) in the warehouse instead of per-chart.
Pro Tip: capture the three slowest dashboard queries for a week. Create one summary table per path, reroute those visuals, and measure time-to-first-chart. Most dashboards get 2–10× faster with that single change.
Good hygiene for trust
- Show last refreshed and data source on every dashboard.
- Link key tiles back to the model/metric doc.
- Fail closed: if a critical test fails, hide stale tiles instead of serving wrong numbers.
Delivering data isn’t just moving rows into a tool. It’s creating a safe, fast surface where the right number is the easy number to get.
Monitoring, maintenance, and scaling
Yesterday’s green run doesn’t guarantee tomorrow’s. Treat operations like a first-class feature.
#17 Set up monitoring dashboards
Watch the system, not just the jobs. Your ops board should surface:
- Freshness: max age per dataset/model vs the promised SLA.
- Latency: end-to-end pipeline time + stage times (ingest, stage, marts, tests, publish).
- Throughput: rows/MB processed, partition counts, small-file explosions.
- Test health: pass/fail rates by model; top failing checks.
- Cost/credits (if warehouse supports it): spikes by model or user.
- Usage: Which datasets and dashboards are actually read?
Prioritize by blast radius: a freshness breach on a core dataset beats a warning on a rarely used staging table.
Add alert thresholds per model (e.g., age_min > 120), then chart trends and page on breach.
Runbook basics (one page): symptom → probable causes → quick checks → safe retry flags → escalation path. Link every alert to its runbook.
#18 Manage change with versioning and changelogs
People remember “when the number changed,” not which PR did it. Make changes traceable.
- Keep a CHANGELOG.md for models that feed key dashboards: what changed, why, who’s affected, backfill/rollback.
- Tag releases that alter KPI definitions; include links to PRs and migration notes.
- Publish release notes in Slack/Teams with the one-sentence impact summary (“Net revenue now subtracts refunds; expect −1–2% vs last week”).
- Snapshot the semantic layer/metric store with the same tag as the models.
- For audits, be able to replay a prior state: tag + pinned tool versions + seed data for small fixtures.
## 2025-09-08 -- v2.3.0
- fct_orders: net_revenue now = gross - discounts - refunds (was gross - discounts)
- dim_customer: SCD2 on `tier` (new history)
Impact: Sales Overview / Revenue by Region (−1-2%)
Backfill: 2024-01-01..today (incremental)
Rollback: tag v2.2.4, disable backfill job
Owner: finance@company.com
#19 Build for scalability
Scale is mostly architecture and a few boring habits.
- Choose elastic compute where it helps (BigQuery, Snowflake, Redshift). Auto-scale for backfills; cap slots/warehouses for daily loads.
- Keep pipelines modular: small tasks that fail independently; clear inputs/outputs; idempotent writes (temp → atomic swap).
- Partition/cluster big tables by the predicates you actually filter on (date/tenant/region).
- Cache/roll up expensive paths (daily/weekly summaries, last-N windows). Push compute to where the data lives.
- Tame small files: compact on ingest, use columnar formats (Parquet) for lakes.
- Backpressure & rate limits for streaming: drop or queue non-critical events rather than flooding downstream.
- Micro-batch when “real-time” really means “every 1–5 minutes.”
Circuit breaker idea: if tests fail on a critical mart, publish to a quarantine schema and keep the last good version live. Announce the incident; don’t ship wrong numbers.
#20 Revisit pipelines with stakeholder feedback
Pipelines age as the business changes. Keep a feedback loop.
- Review usage monthly: which models/dashboards earn their keep? Deprecate the long tail with a 30-day grace period and redirects.
- Ask analysts and business owners what’s confusing or missing; prioritize changes that eliminate manual steps.
- Re-validate KPI definitions when strategy shifts (pricing models, new channels, org changes).
- Run a light post-incident review when something breaks: what detection was missing, what automation would have prevented it.
Pro Tip: treat your pipeline like a product: roadmap, feedback, releases, deprecations.
Common mistakes to avoid
Even good teams trip over the same potholes. Here are the ones that cost the most, and how to dodge them.
- “The source is clean, we don’t need validation.”
- Until a column silently changes type or a filter gets added upstream.
- Fix it: add cheap guards in staging (PK uniqueness, row-count baselines, enum checks). Fail fast; don’t wait for marts.
- Business logic buried in BI calcs.
- Five dashboards, five “revenue” formulas. No version history, no tests.
- Fix it: centralize metrics in code (dbt/semantic layer), test them, and reference from BI. PRs change the truth, not drag-and-drops.
- “We’ll automate later.”
- Manual runs work—until vacations, month-end, or daylight savings.
- Fix it: put an orchestrator in place early. Schedule, backfill, retry, and gate publishes on tests.
- Over-engineering the easy path.
- Kafka for a weekly HR CSV. Three microservices for a single S3 drop.
- Fix it: match the solution to the latency and volume. Batch until real-time is truly required; micro-batch if “real-time” means 1–5 minutes.
- No documentation or lineage.
- Every incident becomes an archeological dig.
- Fix it: keep models in Git, generate docs, and maintain lineage (raw → staging → marts → dashboards) with clear ownership and on-call routes.
- Zero-row “success.”
- Tasks succeed; nothing lands. Metrics flatline.
- Fix it: alert on zero rows vs a rolling baseline and on freshness SLA breaches per model.
- SELECT * in production.
- Schema drift breaks dashboards and blocks pruning.
- Fix it: select explicit columns; treat schemas as contracts.
- Timezone and currency drift.
- Numbers differ by meeting because inputs weren’t standardized.
- Fix it: store timestamps in UTC; keep original tz in a column if needed. Carry currency_code; convert with an FX table.
- No SLAs.
- “Fresh” means different things to different teams.
- Fix it: set per-domain freshness targets (e.g., fct_orders ≤ 120 min) and page on breach.
- Backfills without guardrails.
- Duplicates, overwrites, and stale caches.
- Fix it: run backfills in a quarantine schema, use idempotent merges, and only swap after tests pass.
Final thoughts
Reliable pipelines equal trusted BI. The reverse is just as true.
Think in layers, keep the business logic in code, automate checks that block bad publishes, and watch the system with the same care you used to build it. Use this as a start-of-project checklist and a mid-project tune-up:
- Stand up a source registry with owners, SLAs, and ingestion modes.
- Add staging tests (keys, counts, enums) and make them blocking for critical paths.
- Wire freshness and zero-row alerts to a runbook and an on-call route.
Share the playbook with new teammates so they inherit good habits—not brittle ones.