All connectors > Amazon Redshift

Amazon Redshift

Make sense of all your data in Amazon Redshift.

redshift logo

ClicData + Amazon Redshift

Get data from Amazon Redshift in minutes with our connector

Connect and unify data from any source

Instantly connect all your Amazon Redshift data to 250+ applications, systems, databases, or files, on-premise or in the cloud. Clean, transform, and forecast your data for a single source of truth.

Customize & automate your reporting

Go beyond Amazon Redshift analytics to visualize any KPI in custom and fully interactive dashboards, or pixel-perfect reports. Automate data updates, alerts, and publication to focus on what matters.

Share insights that drive business impact

Power decision-making at all times with fresh, reliable, and accessible data. Automatically send dashboards & reports to your teams, clients, and stakeholders, so everyone’s aligned.

How to connect Amazon Redshift to ClicData?

animated connectors
  • 1 Set up your connection
    Simply create a connection between your system and ClicData in just a few clicks.
  • 2 Get the structured data you need
    Select which data table you want to pull and ClicData will pre-format and load it for you.
  • 3 Transform, visualize, and share your data
    Clean, merge, and filter your data. Visualize it in custom dashboards or reports, and share it with your teams, clients, or stakeholders.

What benefits can you get?

This connector enables you to access data in Amazon Redshift and mix it with other data.
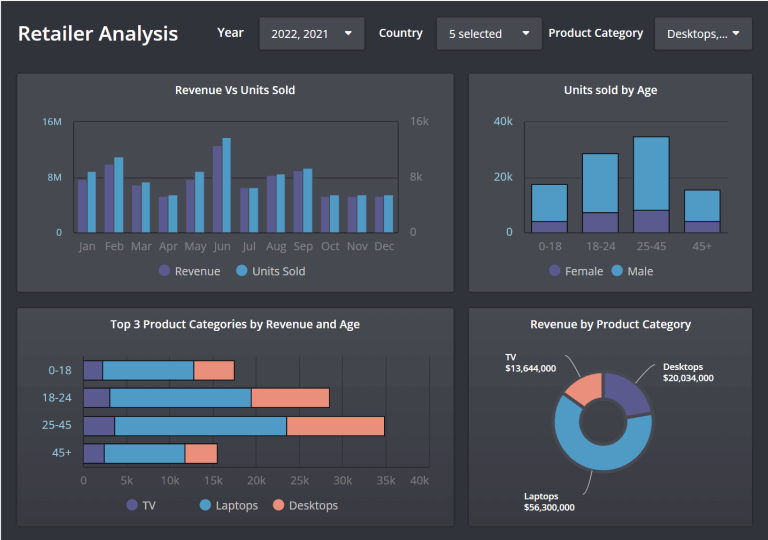
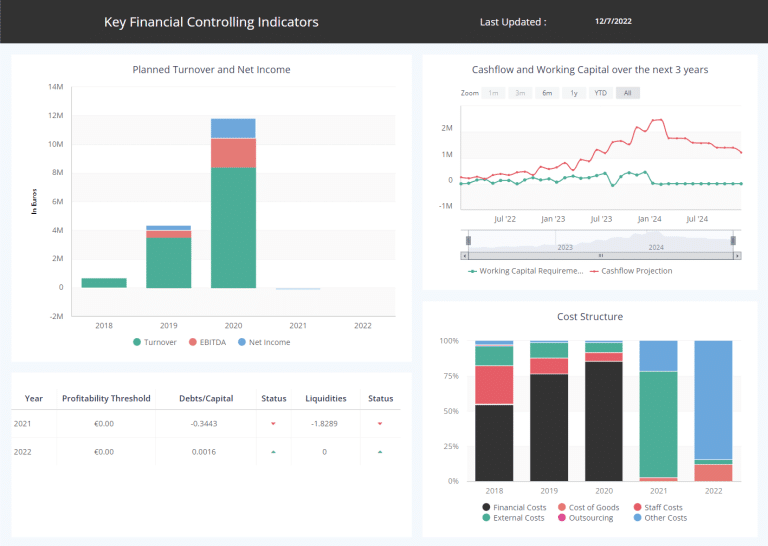
What can you measure?

Any metrics you can imagine that you store in Amazon Redshift can be brought across.

Our customers typically bring:
– Financial Transactions
– Web/eCommerce Transactions
– IoT transactions

Integrate all your company systems and enrich your analytics

Postgre Sql Logo

PostgreSQL

mysql logo

MySQL

logo amazon s3

Amazon S3

FAQ

ClicData offers you more flexibility for your reporting needs, in multiple ways:

  • store historical data to perform YoY analysis and comparisons over time
  • clean, transform, calculate, forecast, and enrich your data with 250+ sources
  • build custom metrics and visualizations that answer key business questions